Exercise 6 will complete the basic modelling in n4ce by taking Sections, projecting between two surfaces and the creation of Drawings. Backcloths will be introduced, but covered in more detail in the next exercise.
- Open the project Exercise 6.sdb. This has two Models Ogl and Stage8, both of which have DTMs. For this exercise, we will view both Models together and re-introduce Backcloths.
-
Focus on the Stage8 model in the Project Tree and view graphically.
 Select Backcloths icon from the view icon bar. You will see a tabbed dialog box identifying available Models, CAD and Images.
Backcloths, Selection and Changing Colours -
Move the model Ogl from Available to Selected using the arrow > buttons. We will see later that CAD and Photo Images can also be used as Backcloths. Close the box and redraw the screen.

Query Icon BarBoth models will be seen together, but this time we have full editing of the foreground Model, Ogl, and can Lock to detail in the Backcloth. The first three icons in the Query bar control the model you are using
If it helps, we can set the colour of the Backcloth Model Ogl, to distinguish it from Stage8. Try the hot key combination [ALT+B], focus on Ogl on the right window and set the pen colour to Light Grey, as shown above. Press OK. You will see Ogl fall into the background with a Light Grey Colour.
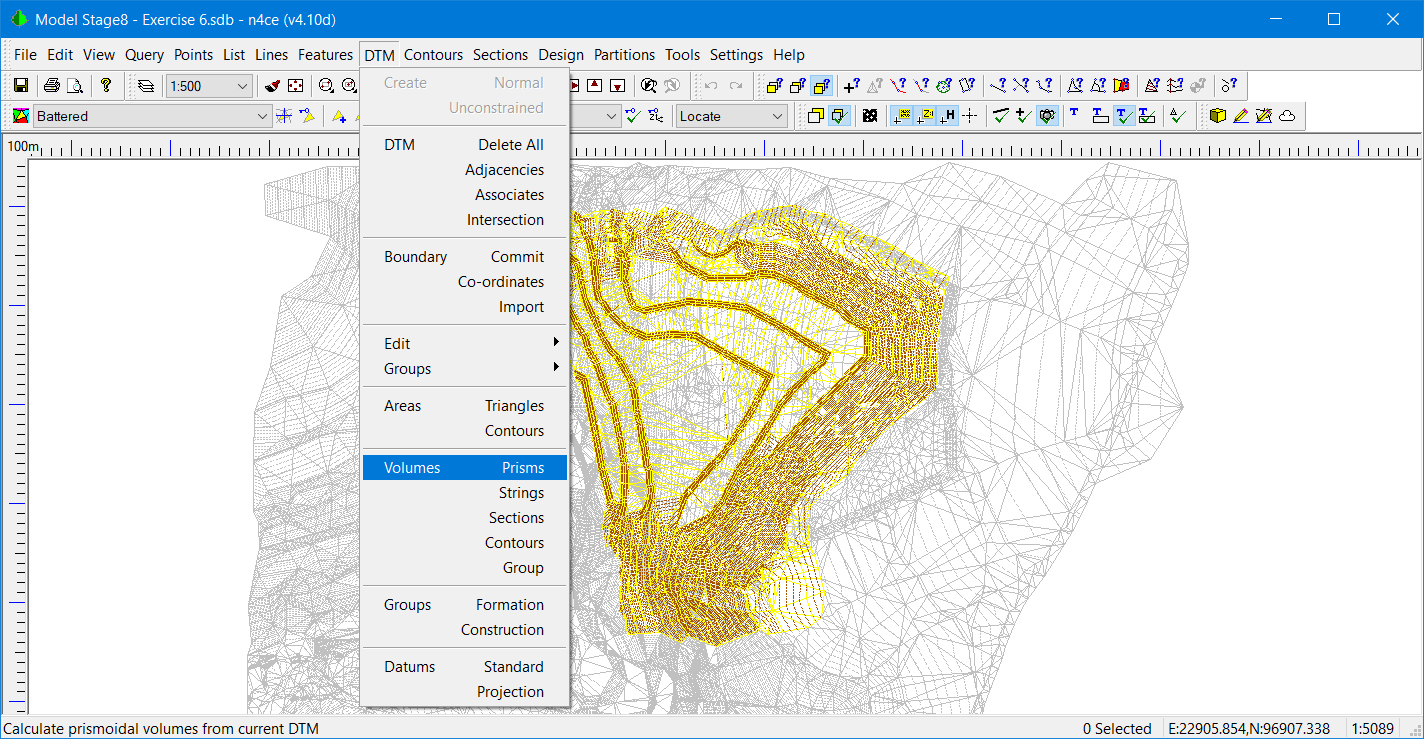
Stage8 with OGL in a Backcloth - DTM Prism Vols
If you want to turn items off in the background, for example contours, a Layers button is available in the Backcloths dialog shown previously. - We have confirmed that both models overlap and can calculate the volume difference between the two. From the DTM menu choose Prism Volumes. The Projected Surface option is automatically selected. Press OK to continue.

Selecting the Reference DTM
Highlight and select the Ogl DTM from the resulting dialog box and press OK. n4ce displays the extents of the DTM we have chosen as a reference surface. Press OK to proceed.
- In this example we are interested in the difference between the Quarry as it stands now, and the re-design, with new bench and battering. This Design was created in n4ce, but is not covered here.
During the Prismoidal volume calculation n4ce calculates a height difference Model, or Isopachyte, as previously discussed. For large models this could take a while, and after the process the results will appear in a Rich Text editor, as shown below.
Results of Volume Calculations between Stage8 and Ogl
After careful inspection of these results you should query the signs. Why is the quantity in Fill when we intend to remove material? Clearly there has to be a sign convention, and the sign of the result depend upon whether you take model A from B or Model B from A.
The Swap Cut and Fill option was introduced to correct the sign. We should have started with the Ogl Model referencing the Stage8 Model?
Note Ask yourself what what you have to do the current model to make it become the reference. - Many users prefer to determine volumes by Sections using End Area calculations, although the results are not going to be as accurate as those by prisms, but you can “see” the process. We have introduced Section Volumes in Pro and Des editions.
Many people like to "see" the results, so to satisfy the skeptics let’s look at qualifying these volumes by taking sections.
From the Sections menu of the model view choose Long Section. The following dialog box will appear.
Long Section Parameters
This dialog box allows you to select the method of taking sections and what they interact with. The Models tab allows you to select multiple Models. - Select the Models tab and move Ogl to the Selected window. Return back to the Definition tab and make sure the Cut Line is by Sketch and the Profile intersects the DTM Facets and Features.

Selecting Models to Pass a Section Through
A multi leg section can be sketched out, but in this example simply sketch out one leg then right click to terminate. A viewing window appears with various edit options are available including Exaggeration, Mirror and Attributes.
Viewing the Section through Two Models
Note Sections viewing conventions are from the right in the direction of the section.
 The Attributes Icon is used to change the colours of profiles so that you can see each profile more clearly. Change Ogl to green and Stage8 to Blue. Other options are available here which you might wish to investigate.
Changing Attributes of Each Profile
The panel on the left, called Cursor, display the cursor position and coordinates in both models. The colours of the profiles can be reflected in this panel and you will see a height difference between the two section profiles. The position of the cursor can also be seen in the plan view. Ideally the two views should be on separate monitors.
When you close the preview Section window, you will be asked to save the section. Use the name Long Section. Close the Graphics window and return to the Project.
Note The section appears on the Project Tree. - The section preview is only for visualising the section. To plot the section with Drop Lines and Text, this is done either as a Drawing or in CAD. In either case, you will be given access to CAD tools. The former is in Paper Space, in the latter Model Space.
Let’s look at plotting the Section in CAD, using model space. CAD, and Drawings, will be covered later in the next exercise. Right click the CAD folder on the Project Tree and select New.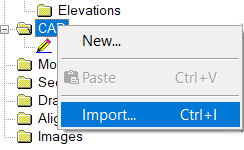
Selecting a New CAD Folder
In the General tab set the name to Long Section Plot, the Scale to 500 and the Units are set to Metres.
Setting CAD Folder Parameters
In the Paper tab, you will notice that there are facilities for selecting an appropriate Paper Size, including user defined. Select A1 and return to the General tab.
Check the button called Show Drawing Border. This will produce a box outline in the graphics view which represents the sheet size chosen at the given scale. - Go into graphics. This is the CAD editor, which is signified by the grey Drawing Parameters panel on the left (this can be turned off).
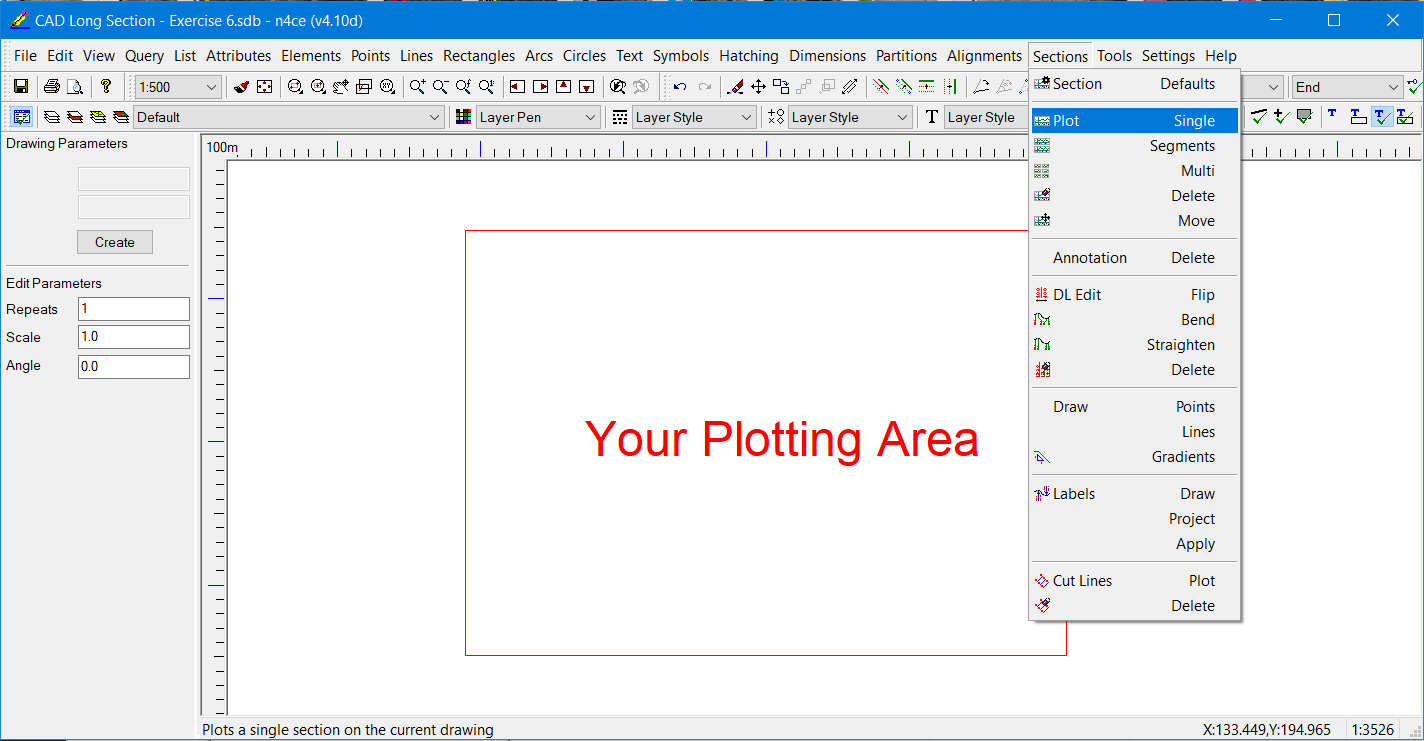
CAD Editor - Sections Menu (Des) - From the Tools menu select Section Plot Single. A dialog box will appear identifying all the single section profiles stored in the Project. The Multi option is used for plotting Cross Sections. In the Pro and Des editions, you will also see further section plotting/editing options.

Section Selection
Select the Long Section profile. You will then be presented with the Section Plot Parameters dialog box. The Section Plot Parameters dialog box, shown below, contains all the necessary settings for plotting your section.
On the first page, you will be invited to enter Hz and Vt Scales, Min and Max Levels that size the Profile box. The levels offered are those found in the profile.
Section Plot Parameters
Set the Vertical scale to 500 and round down the Datum Level and up the and Top of Box values to provide gaps at the top and bottom of the section in the profile box. - When you press the Profiles button, the following screen will appear.

Section Profile Defaults
Section Profiles is used to alter the Pens and other parameters in the plotted section. The check buttons, bottom right control the plotting of the Profile, Drop Lines and Annotation and benefit of simplifying the presentation. Press the OK button. - The Defaults button takes you to Section Plot Defaults, a multi tabbed dialog box.

Section Plot Defaults
The Profile, Multi, Lines and Line Labels are used as general defaults and are not used here. Each tabbed screen has its own settings, some of which are discussed here. Most of these options are self-explanatory, but go to Help [F1] for more information.
The first option you may wish to look at is table annotation. The Define button takes you to the following dialog.
Section Table Annotation Defaults
Items from Available can be moved to the Selected window. Double click on any of these items brings up further options, like decimals.
Move the East and North over to the right and set the decimal places to 2, Chainage to 1 and Heights to 3. Move the order of plotting annotation with Height at the top and Chainage at the bottom.
Note the create button. This allows you to create additional options like difference between two surfaces. - The Plot tab controls plotting of Scales, Titles and Cut Line coordinates. The Areas tab controls plotting of sectional areas to another DTM, Closed ends or a Datum surface.
- The Sizing tab allows you to set the size of the Title Box and where the section profile starts and ends. The Grids tab allows you to plot reference lines and within the profile window. This may help if you wish to scale off heights from the section.
- The Drop Lines tab controls the plotting of drop lines and filtering of text, as shown here.

Section Drop Lines
Frequency options include None, Features, Interval and All.
The Filtering options include None, Flip, Clash and Flip & Clash. This allows control over plotting table text.
Set Frequency to All and Filtering to Flip & Clash. - Now that we have set the Section Plot Defaults press the OK button. You will be invited to enter a CAD Layer name onto which the section will be plotted. By default, this will be the name of the section.

Layer Name
Note Only one section can be plotted on a single layer. This is because the plot parameters for this section are stored within the layer.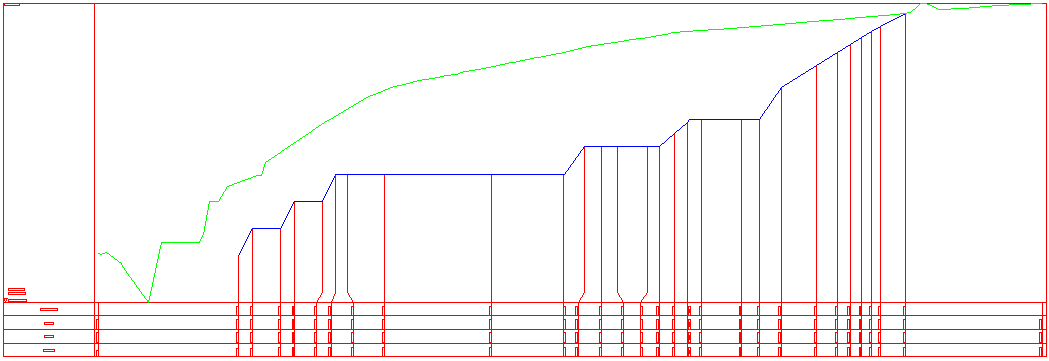
Plotted and Edited Section in Model Space
Drop lines from the OGL have been omitted in the above plot. Use the Zoom function to move around your plot. If you are using Pro or Des editions return to the Sections menu to see the additional edition functions, including Delete DL and Bend DL. This has been plotted in Model Space. A similar plot can be placed in a Drawing using Paper Space.
Note: Since the Section was plotted in Model Space, distances shown in the ruler will match those of the chainages. This may be useful when querying the section distances. This is not possible with sections plotted in Paper Space. - The plan (cut line) position of the section will appear temporarily on the screen. After a redraw it disappears. This cut line can be plotted on the screen using the Tools menu and Section Lines Plot. A dialog box allows you to set various defaults, as shown below.
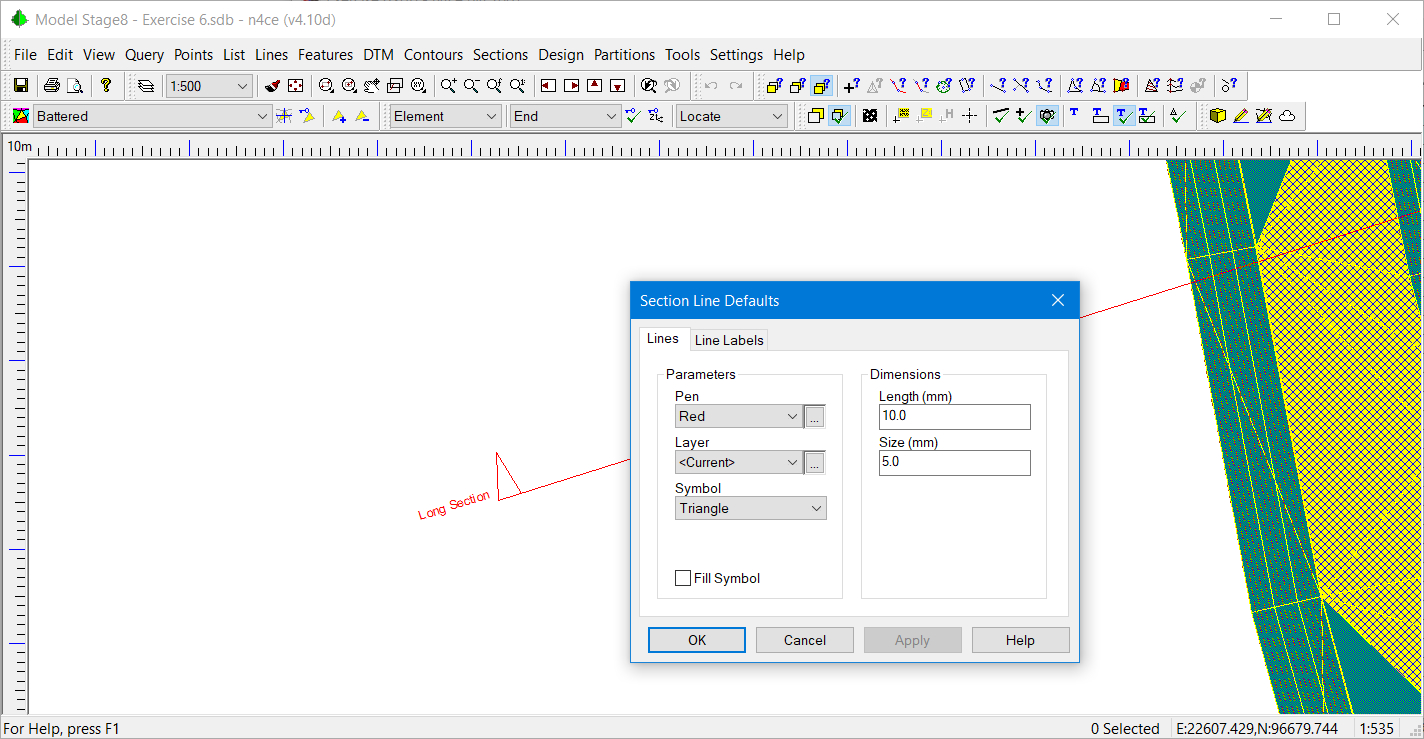
Section Line Plotting
Note This Cut Line appears in the models Dedicated CAD Backcloth.
Summary of Exercise 6
Exercise 6 carried on from the previous Exercises 5, using multiple Models. The concept of adding a Backcloth was further investigated. This allowed us to overlay a second model so the visual interaction could be seen. If a model Backcloth is present, then entering the 3D Viewer will automatically display this as well as the current model.
Backcloths will be investigated further in the following exercise, especially where CAD is involved.
During Exercise 6 we created volumes between two models using projections and looked at how long sections could be taken and stored in the Project Tree.
We also learned how to configure Plotting Defaults for sections and to plot them in CAD using Model Space.

Comments
0 comments
Please sign in to leave a comment.