In the last exercise, we used n4ce to correct errors which had been introduced into the DTM during its creation, allowing us to use this edited DTM to calculate areas and volumes.
Before we look at these calculations we should introduce a refinement here. n4ce has a facility to partition a DTM into different zones, called Groups. This helps to sub-divide a model into distinct parts, identifying zonal area types like road surfaces, pad foundations or different spoil heaps for individual quantities.


Using DTM Groups With a Proposed Development
![]()
Groups Icon Bar
![]() Groups are accessed via the Jesters hat Icon. The further Icons to the right of this control selecting, locking, adding and removing chosen groups to triangles.
Groups are accessed via the Jesters hat Icon. The further Icons to the right of this control selecting, locking, adding and removing chosen groups to triangles.

DTM Group Status Dialog Box

DTM Group Definitions
Groups can be given a Depth to allow volume calculations to be made to formation levels. You will also note that a Group can control the plotting of Contours. For example, if you wish to eliminate contours inside a building.
Groups contain a Fill Style (pattern, foreground and background colour). A Texture can also be associated with a group that will apply when viewing the model in 3D, producing realistic images.
Groups can be created and saved for future use. Like Layers previously discussed, they are unique to each Model. It is best to define and Save Groups in the Project Setting menu.
The Pro and Des editions allow the definition of Construction of depths within a given group. These must be defined separately.
The following exercise will use simple Groups in calculations.
Exercise 5. Groups, Areas and Volumes
During the previous five exercises, we have used n4ce to format and reduce raw survey observations, set up new codes, edit feature strings, create and edit DTMs and use Groups to separate area and volume calculations.
- Open the project Exercise 5.sdb and view the models called Areas and Volumes.


Graphical View of the Areas and Volumes Model - Use the Layers Icon to turn on the DTM Group layer. Redraw the screen and view the Model in 3D. The shaded areas in the Model represent a Group which is called Horizontal identifying the flat steps of the quarry.
Now go to the DTM menu and select the Areas option.
The triangle area results are presented in a rich edit text window like that provided by Notepad. A further option is available to plot a Table.
As you can see from the table of results the calculations are split into groups.
Unassigned refers to triangles which have not been allocated to a group. Therefore, from the results above we can see that triangles, which have not yet been included in a group, total 210374m2 in plan with a slope area of 250928m2. (Your results may be different.)
The Horizontal may not have shown up when we initially viewed the model because the DTM Groups layer may have been turned off.
Its also possible to generate a plotted table of the results.
- We’ve seen how groups can be used to identify different areas of a model. We’ll now create a new group called Batters, which we use to identify steep slopes (Pro & Des).
-
Return to the model view and press the
 groups Icon.


This will display the Group Status, Identifying Horizontal as being Current. Press the Groups button to see and edit the groups attached to this model. From this dialog box select the Load button to install further groups, as shown above. These are stored in the ..\Settings\Groups.ini file.Move all groups from the Default window to the Selected window, using the arrow > buttons, then press OK.
-
From the DTM Groups dialog box select Add. Enter the name Batters. Change the Fill Style to Banking and ensure that the layer is set to DTM Groups.
 You may wish to change the Fill Style. Pressing the Properties button alongside Fill Style allows you to set up your own fill pattern. Return to the graphics screen.
 -
From the DTM Group Status dialog box highlight the Batters group and press Current. Any grouped triangles will now be added to the Batters group. Highlight the Horizontal group and press Lock. Locking a group prevents it being overwritten. Now press OK.
- Use the Add Triangle tools, shown here, to add the Batter group to triangles by Slopes.
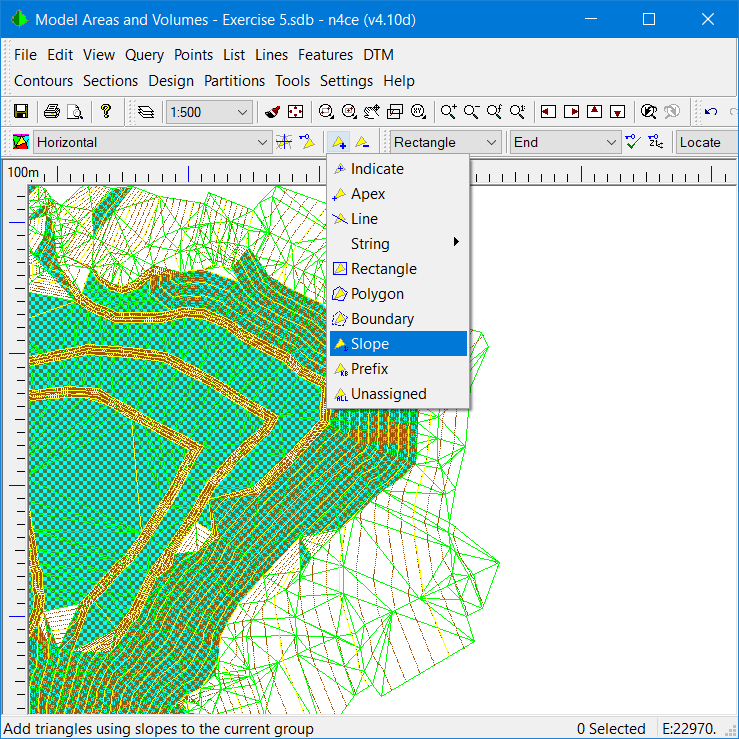

The adjacent icon to the right removes Groups from Triangles. -
If you are having difficulty in seeing which triangles need to be added, use the 3D preview to help you. You cannot accidentally add any triangles which already belong to the Horizontal group, since this is locked, so don’t feel too inhibited. There’s always undo!
The model should finally look something like this.
-
It’s now possible to calculate areas, considering this new group, but we’re more interested in volumes here.
We will calculate a simple volume for the time being, using a datum height to act as a reference surface. Select Prism Volumes from the DTM menu. The following dialog will appear.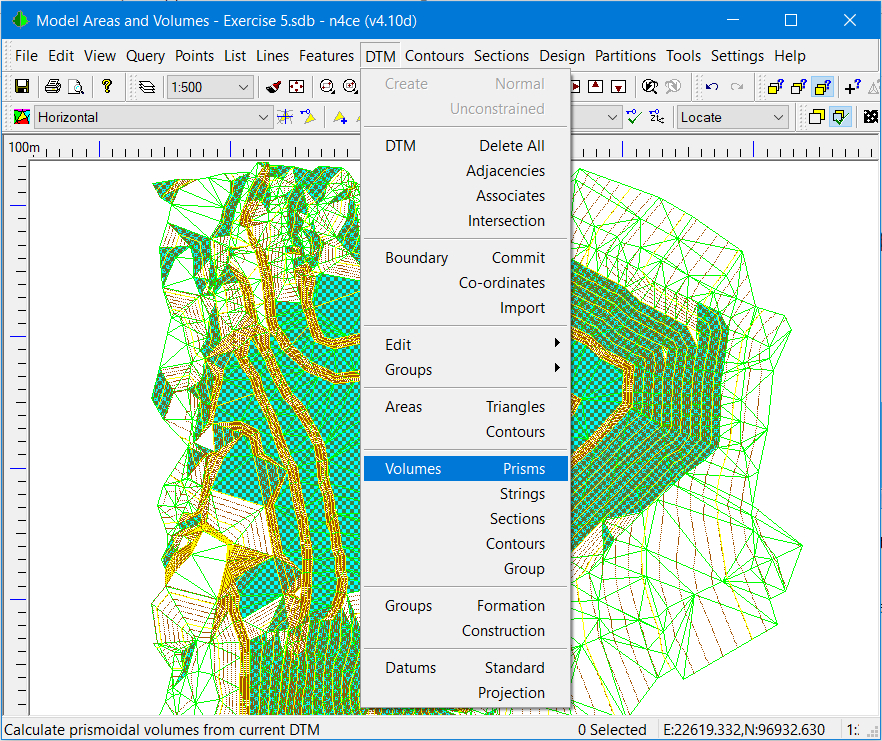
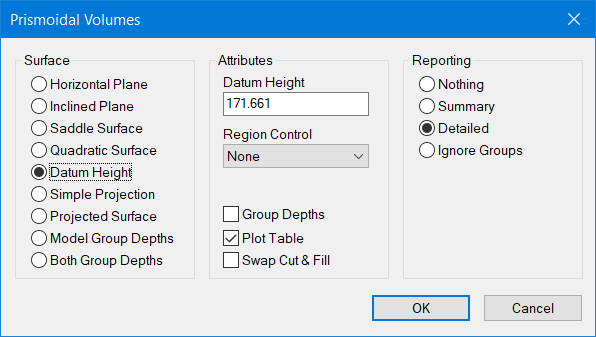
The most popular and accurate method of calculating volumes is by Prisms. Here the triangles making up the DTM are projected up/down to a Reference Surface, or Datum creating Toblerone type columns. When projecting to another DTM, a complex surface called an Isopachyte (ht diff model) is formed.
The volumes in these columns are summed to give overall quantities of Cut and Fill using the simple equations.
Volume = ∑ [(h1 + h2 + h3) / 3] * Aplan
Where h1, h2 and h3 are the ht diffs to the reference surface, and
Aplan is the plan area of the triangle
In the example used here the Datum Height being offered (171.6605) is the lowest level in the survey. Set this to 170 and press OK. A Report and a Table are available, as shown below. You will have to locate the latter in the graphics view, and appears in the dedicated CAD backcloth.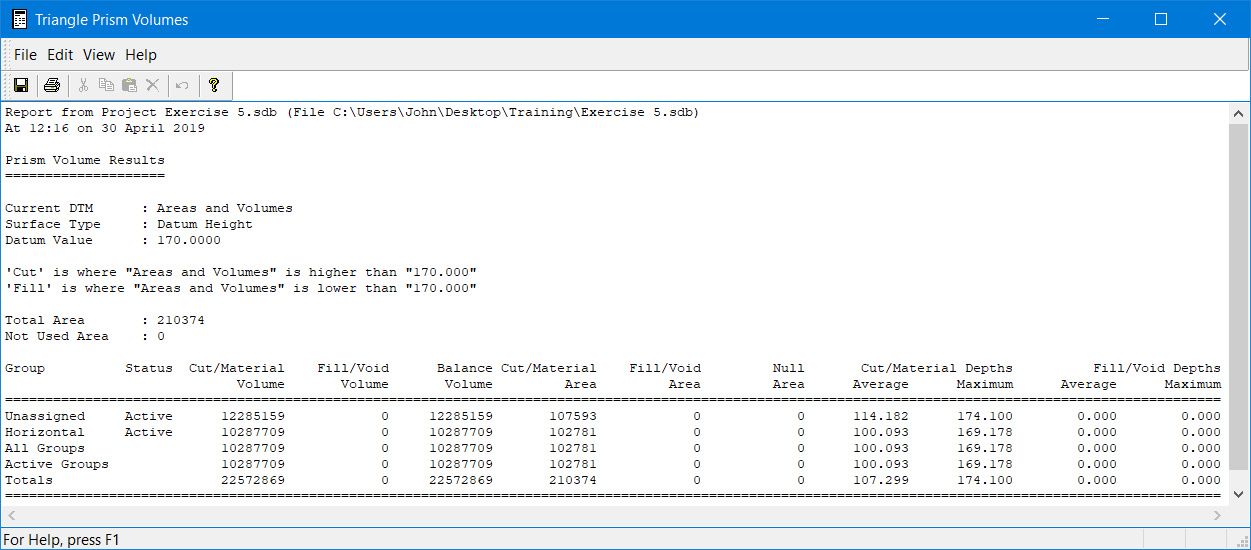

-
n4ce presents the volume calculations like the area results we saw earlier. Again, these results can be saved to disk as a text file, or cut and pasted into a word processor for presenting reports.
Let us analyse the result. Since the Reference Surface is lower than the model we expect that the quantity is Material or Cut. This means material is taken away to achieve the Reference Surface value.
Note Quantities are always based on triangles above the reference surface being positive (Cut/Material) and triangles below this surface being negative (Fill/Void). You should always display and compare the Original (DTM) to the Final (Ref) for the correct sign convention.
You will note that the Prismoidal dialog has a feature which Swaps Cut and Fill quantities. This may apply if you have the Final model active on the screen and the reference surface is the Original pre-constructed model. This applies when calculating volumes between two models where Groups may be involved in the final model.
When calculating volumes between two models the process introduces a Projected or Isopachyte surface. This is Complex Height Difference surface calculated by projecting both models together forming a multifaceted surface. In doing so it overcomes the major problems when comparing models for volumes, namely.
* Honours Breakline Constraints in both Model.
* Only common overlapping Boundaries are used
* Problems with varied density Models removed
You will also note that there are other Reference Surface options. The top four relate to Reference Surfaces being calculated from sampled points in a model, typically from say a spoil heap base. We will use the Inclined Surface in the next example. -
Return to the Project, right click over the Models and Import the file Heap1.acd from the ..\Training folder.
Use the knowledge gained in previous exercises to edit the DTM so that triangles follow the external boundary, and removing those from the gap, as shown here.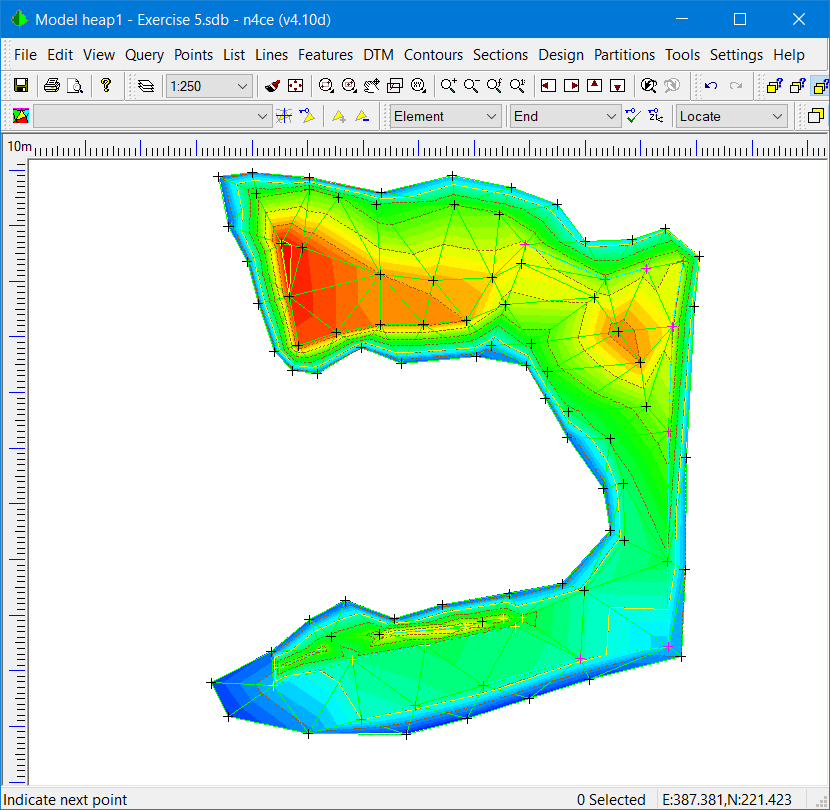
Note If points don’t appear check that layers are not turned off. When importing points, the layer status will be copied from existing models! - We’re going to use sample points along the base of the heap to calculate a Best Fit Plane. This plane will then be used as the Reference Surface to calculate volume quantities.
Select Prism Volumes from the DTM menu and choose the Inclined Plane reference surface.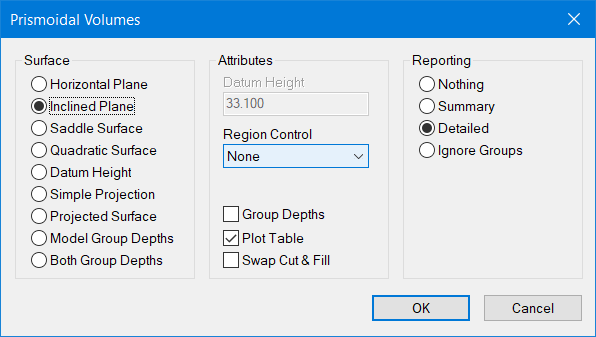
Now select a sample of points around the edges of the model. Enlarged point symbols will appear at these selected locations.
Press OK to continue. A listing of the points and coefficients used in the best fit calculations will be presented with the volumes quantities and other useful information, like areas of cut/fill and max offsets. A plotted table option is also available.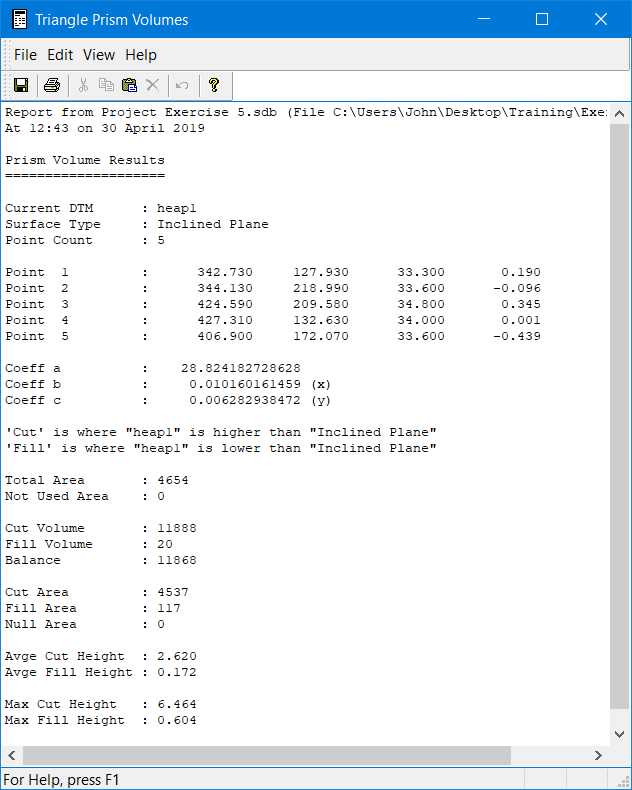
- Let’s go one stage further and add a base surface to this Project and compare two models for volumes. Right click over Models in the Project Tree and Import the file Heapbase.acd, from the ..\Training folder. Create a DTM.
 Would you like to see both models together in 3D? We will use the Backcloths option to do this in both plan and 3D.
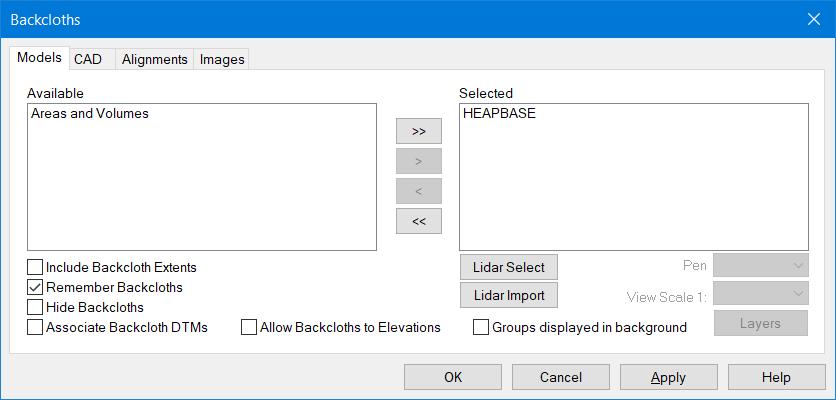
Select the first icon in the Display icon bar. This will display all the models available. Also, note that CAD, Alignments and Images can be used as backcloths. From the Model tab move heap1 from the Available window to the Selected Window.
If you focus on heap1, in the Selected window, you can access the Pen and Layers button, to make changes to the display. In this case leave them unchanged. Press OK. - You will now see the two models superimposed. The colour of the backcloth and its layers can be altered, as identified earlier.
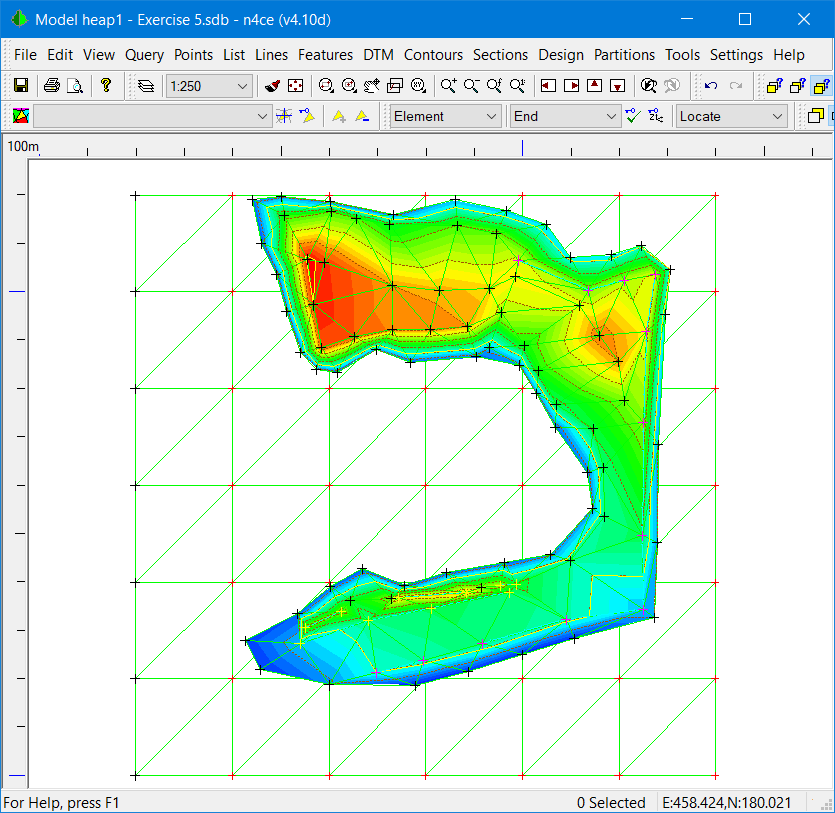
Now select the 3D icon and change the colour of the Heapbase model to maroon. Try experimenting with the options available including height scale and transparencies.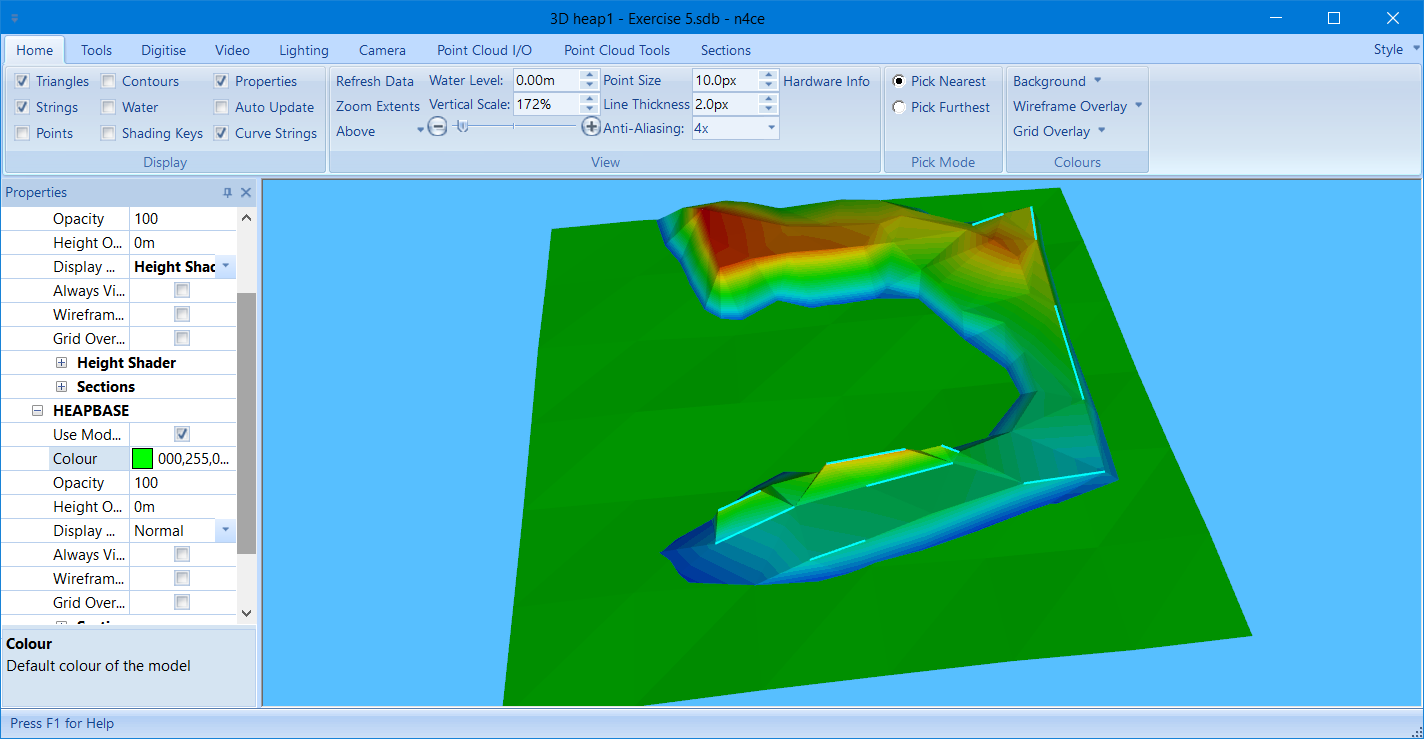
- Close the graphics windows. Focus on Heap1 on the Project Tree and enter graphics again. Select Volumes Prism from the DTM menu and check the Projected Surface radial button.
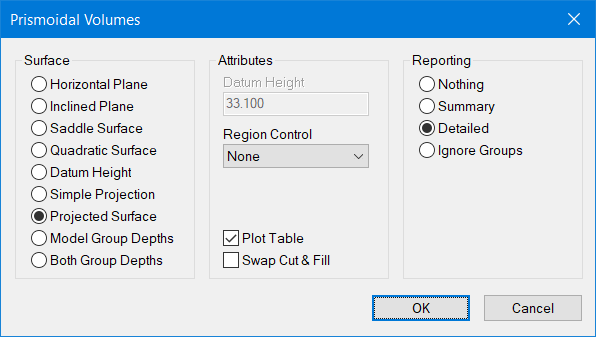
We are going to use the Heapbase model as a Reference Surface. So, any quantities above this surface will be positive or Cut/Materia and Fill or Void will be negative. If you want the reverse the sign convention, then press the Swap Cut and Fill check button.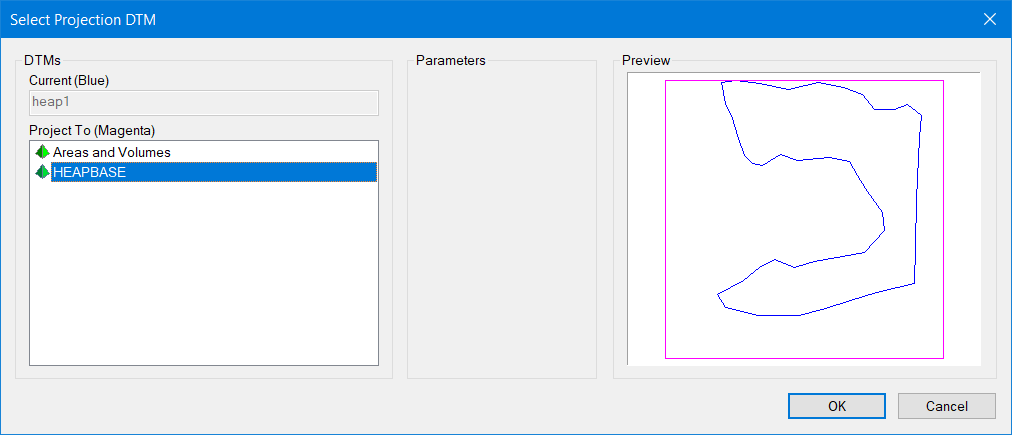
Having pressed the OK button, the model Projection box will be presented, as shown above. It’s always useful at this stage to see if your reference model overlaps the model you’re working with. Your only option here will be Heapbase and it fits!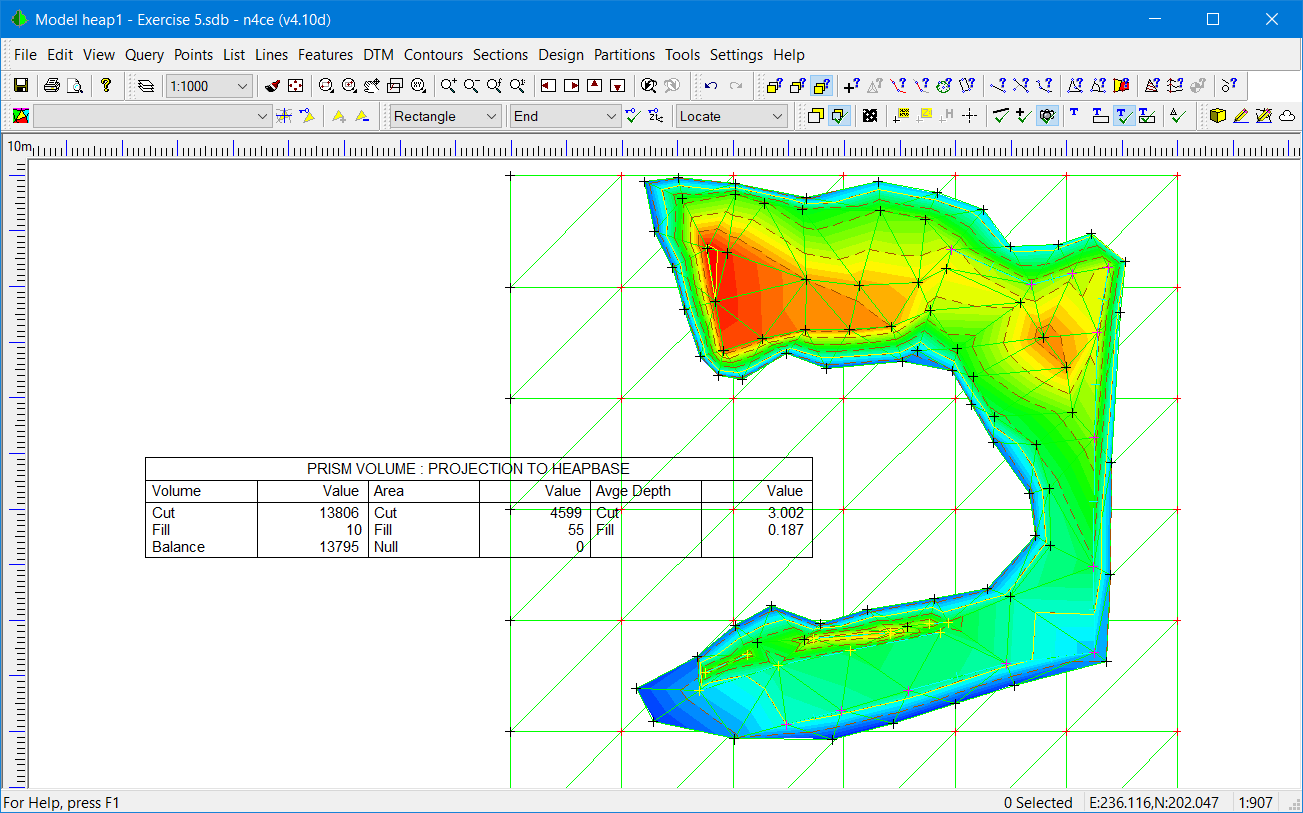
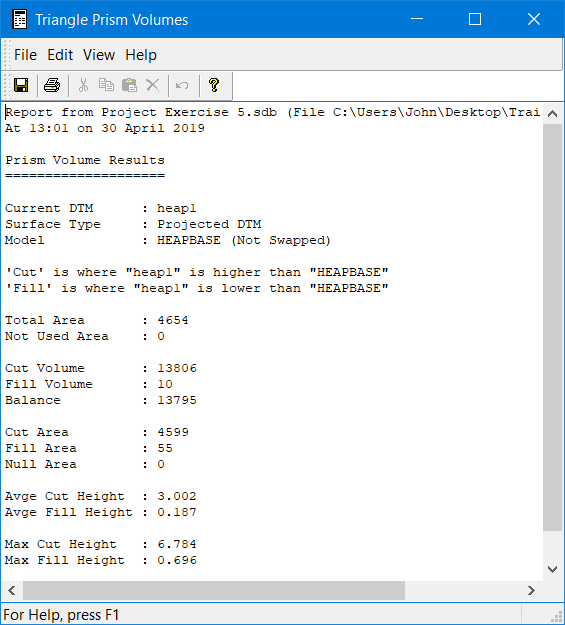
Pressing OK, will result in the presentation of volumes, as shown above, including a Table. It would be interesting to check the volumes between these two sets of results. Go ahead and do it!
Note, the sign convention is VERY important here. Think what do you have to do to the CURRENT model to make it become the REFERENCE surface. If it helps, always have the OGL as current. If final Design is on the screen (with Groups) use Swap volumes.
Summary of Exercise 5
This exercise explored how we used DTMs to present contours and calculate areas and volumes.
We saw how Groups could be used to subdivide the DTM into zones and the various ways in which triangles can be added to a Group.
The 3D viewer provided additional information by allowing us to see the grouped triangles in 3D and checks to make sure that the appropriate triangles had been grouped. It was also shown that the 3D viewer can update automatically when editing a model in plan.
Finally, calculations were made for volume quantities, using different Reference Surfaces. The sign convention for Cut and Fill was explained, with regards to the Reference Surface.
Some very interesting presentations are possible, given a little knowledge of how n4ce works. Here we have a quarry with three different surfaces representing with the OGL in the middle, Proposed surface at the bottom and Re-instatement at the top, all exaggerated and offset by 25m. You may also wish to investigate the Opacity to allow you to see through one model onto another, as shown here.
You can find this project in the ..\Intermediate folder. It is called Three Surfaces.sbd.
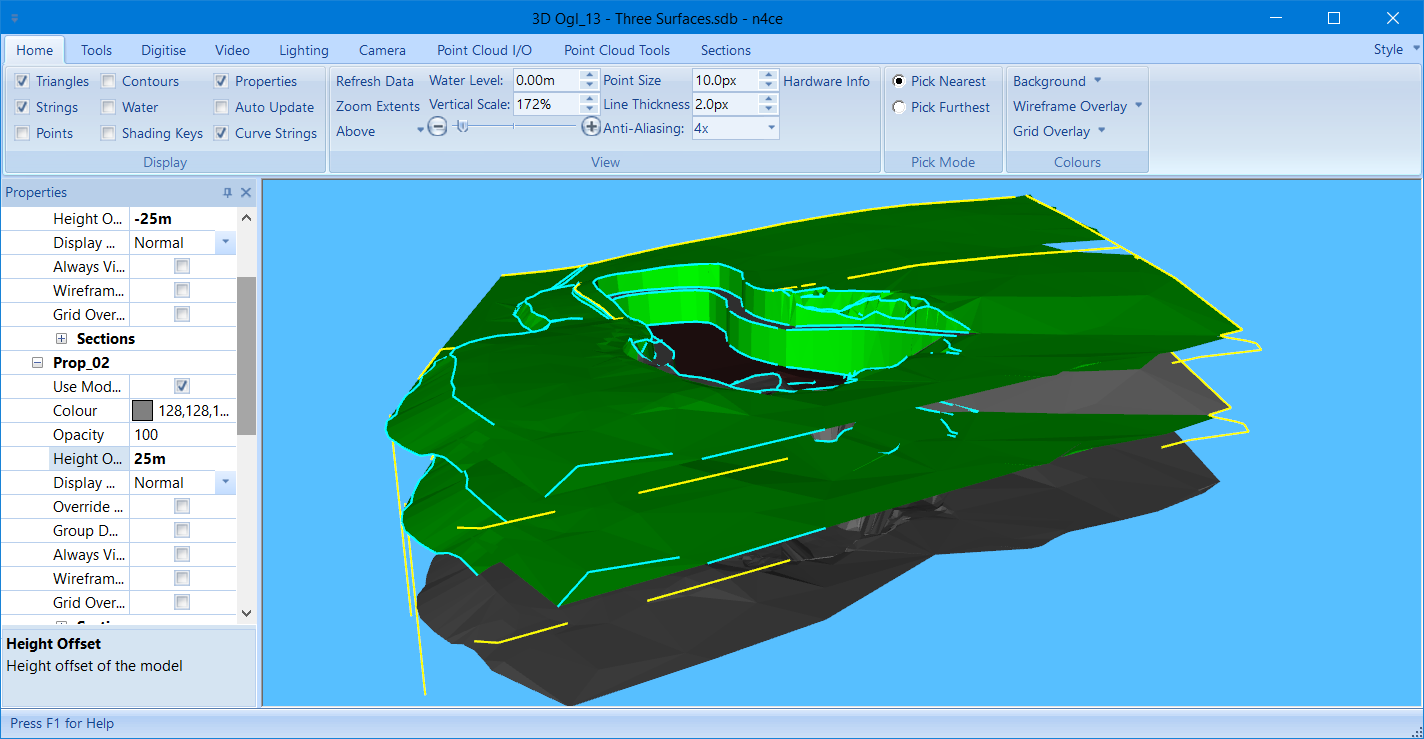
It would be nice to see these surfaces through a cross-section. This will be covered next...

Comments
0 comments
Please sign in to leave a comment.