These notes are provided to allow new users a fast track to understanding how n4ce works, and it's intended to be read with other useful technical documents from AiC and videos on found on our website. Make sure you read the Getting Started manual and see references at the bottom of this article. There are NO short cuts to knowledge; the more you seek the better your progress and understanding!
General Overview
Everything you need is stored in one unified environment, including defaults. This is called the Project and tools are available to see and edit data in both text and graphic forms. Different data types can be stored in this project in their original format, including survey observations, point coordinates, CAD, models, sections, drawings, alignments and images, all accessed using a Project Tree. A single file, called an SDB (survey database) stores each project. The only externally referenced files include images and point clouds.


Multi-Screen Displays with Ripple Through Updates
Unlike many other CAD type applications, n4ce allows multiple instances to be open at the same time, allowing data copying and pasting not only with each project, but across to other open projects. Further, each project has the capability of opening multiple views with ripple through updates to each view as edits are made. Right click menus to both spreadsheet and graphics views, provide easy access to data edits. Hot keys are available in graphics views.
Each heading on the Project Tree can hold multiple data sub folders. A backcloth facility allows the overlay of graphical views from these data folders, with snapping to detail in backcloths. You can mix and match here, so your survey could be overlaid with a CAD image and Geo-referenced imagery.
Features in models are drawn from a look up or code table. Everything hangs off points, so if you move or delete a point everything associated with the point, including the DTM will be affected. A special CAD overlay is associated with each model, allowing detail like sections and tables to be drawn alongside the model.
Models can be viewed in 3D, with tools for interrogation and drawing of features. This 3D platform is also used for viewing our point clouds, allowing the creation elevations and other detail as models.
Finally, a drawing facility is available for creating final presentations, with model and paper space using viewports.
Feature Coding
n4ce uses various defaults that can be found in the Settings menu, with the Code Table being critical in the display of survey data. n4ce converts coded XYZ data into graphical objects by referencing this code table. Codes in n4ce comprise of:
<Code Prefix><Str No>.<Comma Code> eg KB10,C
If you move a point, everything attached to that point will also move, including features, text and DTM apexes. Deleting points has a similar effect.
A feature code like KB (kerb) will typically generate a point, a line and height text on nominated layers, with pens (colours) and object type (line style). If the code definitions are changed the new updates will ripple through automatically.

n4ce Code Table
Note: This is where n4ce Models are different from CAD, whilst visually they may look the same, everything is generated by the Code Table. This intelligence is lost when exporting data into CAD via DWG transfer. DWG transfers are NOT recommended until ALL editing of your Survey has been completed in n4ce.
Importing Data into n4ce
n4ce data filters support all the file formats you are likely to come across in your surveys, including LandXML, Leica DBX, Trimble Link and Topcon, storing this data on the Project Tree. Data includes Observations, Coordinates, CAD, Models, Sections, Drawings and Alignments. Images, including aerial photographs, can be attached to Projects, but are externally referenced. User defined XYZ I/O filters can also be created, including Excel CSV.
New data is introduced into n4ce by right clicking over the appropriate header on the Project Tree, navigating to the location where data is stored on the hard disk, or data card.
If you are downloading data from a total station, you would go to Observations or alternatively Coordinates, if importing from a GNNS receiver. If you have recorded XYZ on your instrument, then you can go straight to Models.


n4ce Project Tree, Multiple Views with Backcloths
Backcloths allow you to overlay different data types. For example, when comparing as built against design, or extracting points from CAD for setting out.
If you are recording angles and distance on your total station, these need to be converted into coordinates either on the instrument, or by Reduction in n4ce. Even if you have processed your observations into coordinates on the instrument, we do recommend that you save the raw data in n4ce, just in case you need to re-reduce these again into coordinates. Tools are available for Traverse, Free Station and Least Squares Network Adjustment.
 |
 |
Least Squares Network Adjustment –Reporting and Error Ellipses
A very popular format for handling coordinate data is Excel CSV. There is no specific format for CSV files so a special tool called Import CSV Files has been created for handling this data type. This can be found by right clicking over Models. You will see a copy of the comma delimited file you are importing, and you will be expected to create your own import filter.
Note: CAD data is brought into n4ce via an AutoCAD DWG/DXF file format. AutoCAD draws text in ground units, normally meters, whilst n4ce text is held in mm units at the current viewing scale. This scale is required to correctly convert AutoCAD text into n4ce text sizes and vice versa.
n4ce GUI & Extracting Points from CAD
Tools used in n4ce are intuitive and include menus, list boxes, icons and hot keys. All items in graphics are layered with attributes for type, colour (pen) and where appropriate, size. Editing and Query options are available either from icons or menus. The camera icons are used to view vector (XYZ) items in graphics. 
 |
 |
Zoom and Display Icon Bars
 |
 |
Query and Modes Icon Bars
Key to using n4ce in graphics form, are the Pick, Lock and Draw list boxes and the Must Lock icons. These control how you select elements, snapping to elements and draw elements in CAD.
Reports are used in n4ce for displaying text-based information, including volumes, in a rich text editor very similar to Notepad. Reports can be printed, saved to file, or copied to another document like MS Word.
n4ce has its own fully featured CAD system, allowing you to add your own CAD detail to your projects. But it’s more likely that you will be importing AutoCAD DWG files, as this is a valuable way of introducing (copying) AutoCAD blocks into n4ce symbols and generating points from CAD for setting out and modelling.
The Query options identified with a question “?” mark, are very useful here, especially Query Point which can be used as a mini editor.
Whilst n4ce CAD appears in 2D, all the elements are stored in 3D. AutoCAD spine elements are not supported in n4ce, so we suggest you explode these in AutoCAD before creating your DWG export file.
Points from CAD can be used to extract CAD data for setting out and model creation, and uses the backcloth facility. After importing the DWG file into n4ce, isolate the CAD layer(s) you are interested in by using the layers icon in graphics, or Status in the project display. In graphics the Show icon 
can be used to identify attributes of CAD items, including its layer. Also use the layer control icons

DO NOT convert all your graphics elements into points, otherwise you will end up with mental overload!
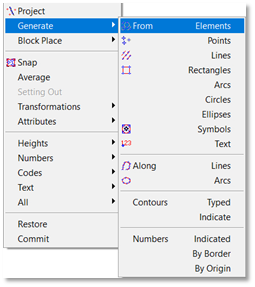
Whilst it’s possible to generate points in the coordinates block, use the option Points->Generate in a model.
Generating Points from CAD
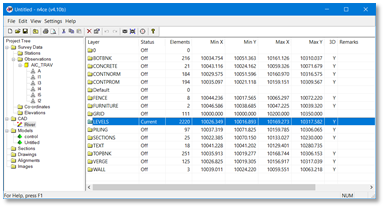
the first step is to introduce the CAD drawing you wish to extract data from, then isolate the layer(s) you are interested in. Please note that you can view layers from the project, as shown below.
 |
 |
Isolating CAD detail for Generating Points from CAD
The next stage is to create a new empty model, but if an existing model already exists with the same coordinate system, this would suffice. Now add the modified CAD folder as a backcloth. You can show the attributes of CAD detail using the query CAD icon.
 This is important as you need to know what elements you’re dealing with!
The Points->Generate option has several choices, depending upon the element type. In the example shown below, the points are symbols and the text are separate. Since symbols can have embedded text, you may have to explode the symbols first.
The CAD element may be 2D or 3D. In the former we need to find a way of generating heights. The listed CAD layers in the project, shown above, has a column called 3D. If this contains a Y, this signifies that the layer contains 3D elements. Other tools are available for generating heights from 2D CAD files.
In the example shown above, the points are symbols and this choice was made from the Generate menu. The following dialog box then appears.
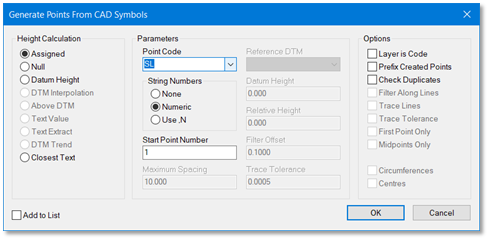
Generating Points from Symbols
If you are working with 3D CAD elements, use the Assign for Height Calculation. If not, you could use the option called Closest Text. There is also a separate option that will generate points from text, using the text value for its height. Points will be generated at the insertion point for the text.
This is where you now use the Pick option mention earlier, which could be Element, Rectangle or List (Pro & Designer).
Returning to the project spreadsheet will reveal the points you have created.
Note: Points will adopt the level of the CAD element. If this is in 2D, then the height column will appear blank indicating a NULL level. If you have isolated level text (numbers) on a layer, n4ce will take these values as a point height and create a point at the location handle for that text element, normally bottom left.
Creating Models in n4ce
Models are where the interesting work is done, like graphically editing and forming Digital Terrain Models (DTM), used for creating contours, sections and volumes.
Right click over Models on the Project Tree to form a New model from Survey Data, or Import XYZ data from an external file. Apart from the inbuilt filters general import Files of Type, there are user definable CSV filters, LiDAR, MX, DWG etc. A Model folder will be created with the same name as the file you will be importing.
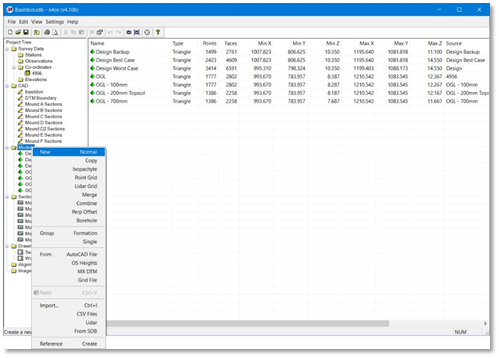
Creating a New Model (Designer)
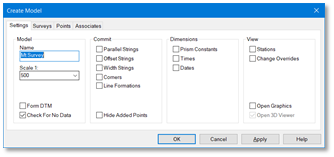
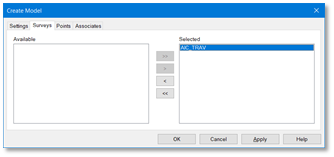
Further options are available when selecting New, namely Normal, Copy, Isopachyte and Point Grid. The option used here is Normal, which copies XYZ data stored in Observations and Coordinates on the Project Tree. The split screen, tabbed window is used here for selection. Once created the Model does not look back or change the original source data.
 |
|
Importing Survey Data into a New Model
n4ce will use the Code Table to draw features, as previously discussed. Tools are available for editing points (copy, delete, move and insert) and features (reporting, create, copy, delete, lines, shapes and symbol specific tools). If you are using comma codes and/or dimensions these will be implemented accordingly.
A Code Reporting option allows you to see each feature recorded and allows you to identify where features are incomplete. Some features need 2 or 3 points to be defined.
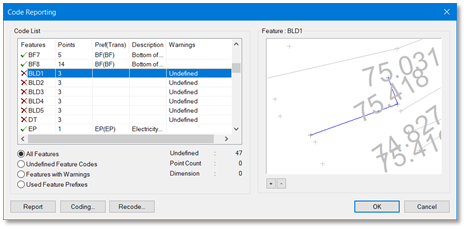
Feature Code Reporting
A pre-view graphics window will zoom to show the feature highlighted on the left. Options are available to create new codes, for example BLD, and for re-coding features.
Each model has a Dedicated CAD Backcloth, used to plot detail that is not directly related to the features or DTM discussed below. Detail plotted here includes curve fitted contours, tables and additional CAD detail, like tadpole symbols and hatching.
Note: An Override to layering is built into models allowing you to turn objects on/off, including the dedicated CAD backcloth. Press [ALT]+[[F9].
Forming a DTM
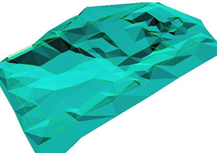
A DTM surface is formed by linking points together, with a series of non-overlapping triangles using a 2D Delauney triangulation algorithm. Since the algorithm tries to form near equilateral triangles, features can be used to form break lines or creases in the model surface.
 |
 |
Since the DTM created is a surface model (2 1/2 D), vertical faces can’t be created, so a small offset (>1mm) should be used when modelling surfaces like retaining walls or kerb faces. Discontinuities, like top and bottom of banks, should be surveyed as linear features and used as break lines.
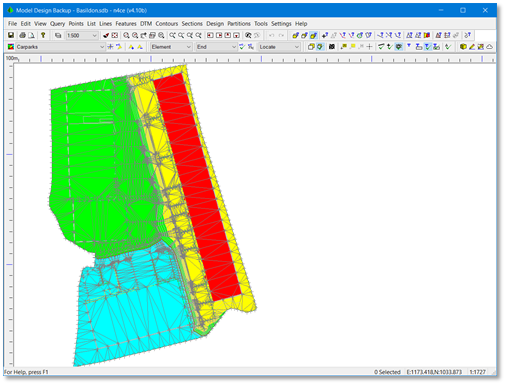
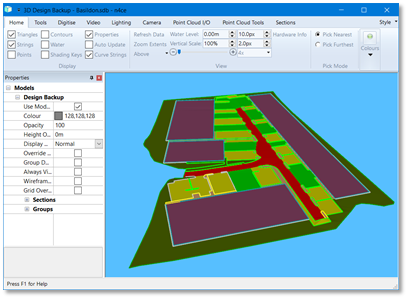
Grouped DTM with a 3D View
Editing tools are available for deleting, inserting and forcing triangles. Groups allow you to isolate parts of the DTM for independent quantities, like spoil heaps. These groups can also control plotting of contours, and be allocated a depth so volume calculations to the underside (formation) can be found.
The yellow Cube Icon allows you to view your model in 3D, either as strings or shaded triangles.
Note: Creating structure to your models, like feature strings, has advantages when using n4ce tools. For example, base feature strings can be used to encapsulate triangles in a heap used in string volumes.
Contours
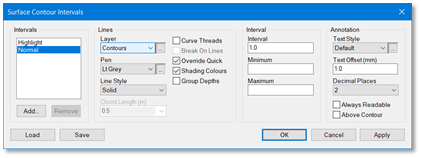
Quick or short straight line contours are formed automatically, when a DTM is created using the current Contour defaults. These will update, on the fly, when zooming and editing the DTM. Groups control areas where you may wish to eliminate contours.
Threaded curve fitted contours can be committed to the Dedicated CAD Backcloth, but turn off the Quick Contours using layer override, otherwise you will have two sets!
|
Contour Defaults |
Contour Annotation |
Contours can be annotated either in Quick or Threaded form. If the text offset is set to zero for threaded contours, text will be burnt into the contour line.
Note: Threaded contours and annotation are NOT updated when editing your DTM, so make sure your editing is completed before committing contours.
Sections
Longitudinal and Cross Sections can be formed in n4ce from either feature strings or DTM triangles. Levels are found where cut lines cross features and/or DTM triangle. Sections can also pass through multiple Models.
There are various methods for locating cut lines. In the case of cross-sections, you will be expected to define a centre line, followed by a chainage interval and left and right offsets from this centre line.
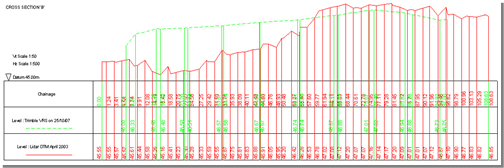
Multi-Surface Section Plot
Sections profiles initially appear in a Quick View, and can be saved in the Project for plotting later in CAD or a Drawing. When moving your cursor over the quick view, its position will be shown in plan. From the Tools menu, select Section Plot Single or Multi (cross sections) and fill out the Section Plot Parameters dialog, taking special care with the Profiles and Defaults buttons.
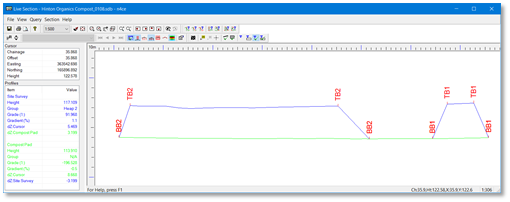
Quick View Interrogation
Note: Individual sections are plotted on their own CAD layer and additional control information is stored in the layer for editing purposes.
Volumes
Volumes calculations need a DTM. In simple terms, triangles in the Current DTM (on screen) are projected to a Reference Surface, which could be another DTM or a Numeric Surface, and the column “Toblerone’s” are summed to give both cut and fill.
Volumes options are found at the bottom of the DTM menu and include Prisms, Strings and Sections. If you are comparing your current model (on screen) to a reference surface, the sign convention is based on what you must do to the current model to make it become the reference, with cut being material (+ve) to be removed, and fill being void (-ve) to be supplied. The reference surface could be a numeric best fit surface, determined from sampled points. Alternatively, this could be another DTM in the same Project.

DTM Volumes Menu Options (Designer)
With volumes by Strings, you will be expected to identify a bounding feature string, which is used to encapsulate triangles by this feature used in volume calculations. For example, the base of a heap. If a numeric reference is selected, the points in this feature string will be used in the best fit surface calculations, normally an inclined plane.
Groups can be used to separate the current model into different regions for individual area and volume quantities. Tools for adding and removing groups to triangles are to the right of the jester’s hat icon. Select this icon to add new groups or import them from previously saved copies.


Shaded Model with Groups Isolating Heaps for Separate Volume Calculations
When calculating volumes between DTMs, a complex height difference model called an isopachyte is temporarily created. Triangles in one model are projected to cut the second model, and where this happens, new points are identified and used with the original points from both models, to generate a multifaceted surface. The nodes of this Isopachyte are the height differences between the two DTMs. In this way, break lines in both models are honoured and only common overlapping areas are considered. Any points and triangles falling outside the common overlap are removed.
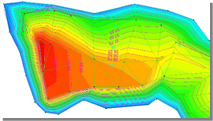
A separate isopachyte model can be created, which is an excellent way of showing cut and fill regions in your model. The zero contour gives you the cut\fill line, and viewing the isopachyte as a shaded model with a large increment (> max ht diff), give two colours showing where cut and fill quantities lie.

Isopachyte Models
Tables and Reports can be plotted and printed, summarising how volume quantities have been calculated.
Point Clouds
As technology in surveying (Geomatics) moves on, AiC has made strides to keep pace and has introduced processing of point clouds into the Pro and Designer editions of n4ce. Whilst everything discussed so far is held in the Project, the point clouds are stored in their own files in sub-directories, as they can be enormous in size, measured in Gigabytes!

Road and Infrastructure Point Cloud
We use the 3D viewer and an OCT tree indexing, to provide fast interactive access. Being built on the 3D platform, means it's possible to inherit many of the functions already present, including digitising and creating a recordable fly through. Tools are also available for generation sections, elevations and automatic feature recognition.
 |
 |
Height Map – Before and After
Models can be created by draping a LiDAR grid format over the point cloud, and using the grid created for generating sections, contours and isopachytes used in volume calculations. Coloured height maps can be generated directly from the point cloud, allowing floor slab highs and lows to be identified from a given plane.
Partitions
There are many situations when you may wish to show parts of a survey, model or CAD at different scales. A further example of course, is Key plans. This is achieved in n4ce using Partitions, which can be found in both CAD and models and is further linked dynamically to Drawings.
Firstly, a Drawing Template is created with a cutting window, or viewport, at the paper size required, either landscape or portrait. The scale can be changed when locating the partition. This template can have a title box, legend and other stand detail already plotted. Dummy text represents table detail, which can be replaced later but it already has the correct location, size, layer and font. Since the template is drawn in CAD at 1:1 (paper space) any detail can be altered later using n4ce CAD tools. The viewport contains data drawn to a scale (model space) using real-world dimensions.

A3 Template with a Title Box – Gray Border is the Cutting Window
The partitions option is available in both CAD and Models and will include any backcloths if present. Various options are available to locate these cutting templates, including an array, as shown below.
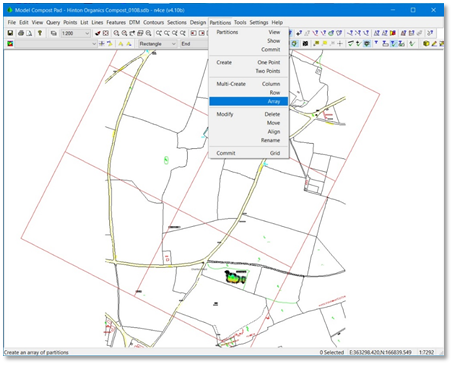
Multi Created
You will be offered a list of previously saved Templates. Here we’re selecting an A3 at a scale of 1:500.
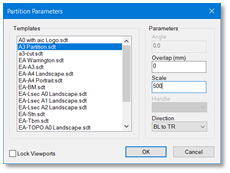
Selecting a Cutting Template
The process of creating partitions will also generate a Drawing(s) automatically. If you open up the partition created and make changes to the viewport, these will be reflected in the plan view containing the key plan.
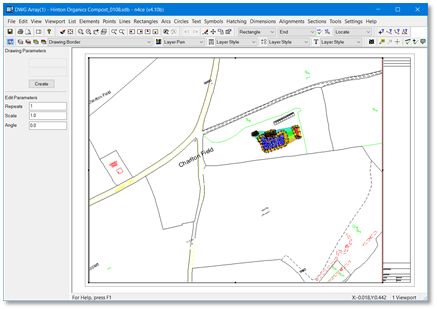
Partition Created as a Drawing
If you are working with multiple partitions, these can be exported as a group into AutoCAD, as shown below. Each tab in AutoCAD is a partition.
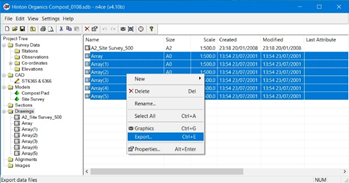
Exporting Multiple Viewports to AutoCAD
Drawings
This is where you may create your own final presentations, prior to plotting or export in a DWG/DXF format or simply a plot. Predefined Drawing Templates can be recalled with title boxes already prepared for consistent presentations. n4ce Drawings uses features that are compatible with AutoCAD including View Ports with Paper Space and Model Space.

Creating a Viewport with CAD, DTM, ALN and Images
After you right click on the mouse, select View then add your Models, CAD and Images, to make composite viewport. Then Centre images and alter the scale accordingly. You may crop the view by dragging in the corners of the grey rectangle representing the viewport at its hooks. The viewport can be moved using the mouse and a 4 way arrow cursor. Images inside the viewport can be nudged into new positions, after holding down the shift key and using the mouse.
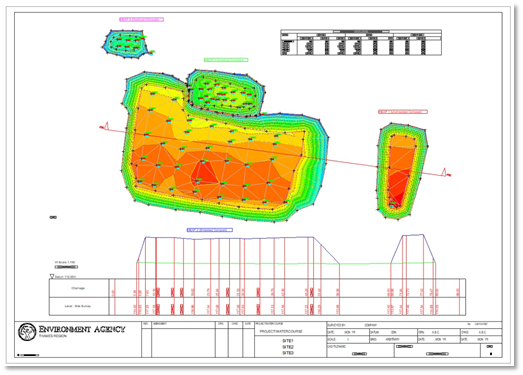
Final Presentation Drawing with Title Box
Multiple viewports can be added to a Drawing. Grids can be added to a viewports, in paper space and then locked. Only one viewport can be live at any one time, as identified by a grey border.
AutoCAD DWG Export and Plotting
Plotting of spreadsheet or graphics items can be done at any stage, with what you see is what you get. See Reporting options (right click over the data folder in the Project Tree) or the Print option in the File menu.
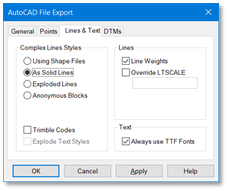
In graphics, the File menu has Export options for DWG/DXF. Again, follow the dialogs tabs to set up your preferences. Complex lines can be exported as Shape file and require the Markers.shp and Markers.shx files to be supplied with the DWG/DXF (copied from the Settings folder on your PC). Alternatively, these lines can be exploded or converted into solid lines.
|
DXF Export – General Parameters |
DXF Export – Line Parameters |
Further References
HDI – Code Table and Features
HDI – Points Coding
HDI – Feature Coding
HDI – Contours
HDI – Sections
HDI – Volumes


Comments
0 comments
Please sign in to leave a comment.