In this part of the Getting Started manual we will look at how we communicate with the outside world. This is normally done through a Drawing, in either paper form or electronic. We will look at other options, including exports to other file formats including AutoCAD DWG and CSV.
n4ce uses standard Windows plotter drivers. If you are familiar with printing from Word or other Windows packages, then this will be second nature to you. But we have added a few caveats!
Plots can be created at any time in graphics, by going to the File menu and selecting Print. But be careful, you may not get what you expect.
n4ce uses WYSIWYG (what you see is what you get). If you are zoomed into part of a Model or CAD, then this is what you will get but it won’t necessarily be to scale. You can zoom to a plotting scale using [ALT+S], but this is a screen scale. Try putting a scale ruler between grids to prove this to yourself.
Grids are an excellent way of checking scales. Before creating plots, you may wish to add a Grid. Several options are available here. We will look at the “on the fly” solution. These are like “quick” contours and are not stored in the database but regenerated when the screen is redrawn.
Grid Defaults are found in the Setting menu and allow for multiple intervals.

Grid Settings
Each interval has its own settings for Layer, Pen Colour, Line Style, Interval and Text Style. As you zoom out the Grid redraws itself including the text labels around the borders of the view.
To turn the Grids on you need to use Layer Override. This is accessed from the Hot Keys [ALT+F9], or the Layers icon.

Layer Override [ALT+F9]
Note The Override option also turns On/Off objects irrespective of layering and is accessed from all model and survey folders.
Having selected Grid Lines in the Layers Override the screen will redraw and you will see the Grid and annotation, as shown overleaf. Grids can be committed to the Dedicated CAD Backcloth, when in a model, using the Tools menu. See CAD Override above. You will be asked to sweep out a rectangle and must turn off the Grid Lines option.

Grid Plot
When plotting, you should take account of the Pen options. This controls what you see on the screen and what will be sent to the plotter.
The default, which controls this, can be found in the Settings menu.
n4ce supports 256 pens. These can be assigned both a colour and a line weighting (thickness).
Other options are available. See below.

Pen Plotting Options
Note n4ce data can be Exported in several formats. The two most popular are AutoCADTM DWG/DXF and BentleyTM MX GENIO. The first is a CAD format and the second a Model format.
Export options are best accessed from the File menu from graphics. In the case of DXF/DWG you will be invited to complete options shown here.
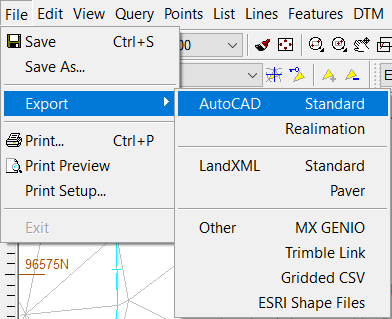
File Export Options
The Realimation should not be used since it has been developed for specialist VR modelling using Mantra 4D software, a 3rd party package.
Having selected an AutoCAD Standard (DXF or DWG) export and filename, you will be presented with a four-tabbed dialog box.
You need to confirm the Scale and Units. The scale should be as the view scale otherwise text sizing will be converted incorrectly.
The version of AutoCAD may be important. AutoCAD 2000 or later is recommended for the latest AutoCAD systems, but may not go into non-AutoCAD systems.

Setting DXF/DWG Parameters
The Points tab identifies how your survey points will be transferred. Three options are available, namely Symbols, Shapes or Points.
The most popular option is Symbols. With this option, you can attach text Attributes, so they are embedded within the Symbols and accessible to Auto LISP routines.
There is a check button for this. But, again this may not be supported by non-AutoCAD systems.

Setting Point Defaults
Complex line styles are available in n4ce, but it’s not that easy transferring them into AutoCAD.
The last tab is for Line definition. You have three options here.
Use Shape files requires external files that hold the line style definition.
These can be found in the ..\Settings folder and are called Markers.shx and Markers.shp and must be supplied with your DXF/DWG file.

Setting Line Defaults
The other options are to replace the complex line style with As Solid Line or Explode Lines. These options negate the need for Shape files and may be preferred by some organisations especially if drawings are being shared. In all cases the 3D component of the line will be retained.
The DTMs tab is used for exporting models for machine control.
The Bentley MX GENIO transfer also has its own default setting. We are dealing with a Model so defaults will be related to the recipients feature codes.
When you select the MX GENIO export option a three-tabbed dialog box appears, like the DXF transfer.

Bentley MX General Export Parameters
In the General tab, you have options which set the Code translator (see Code Table), add String Numbers and additional points along Curves.
If you want to export Text items, like names then check the Text options. The transfer will also recognize curve fitted contours, but NOT other CAD items.
MX does not handle circles and arcs in the same way as n4ce.
These are represented by a series of chords. The Circles tab presents the min values to be used. For example, if the radius is less than 50mm no arc or circle will be created.
If the perpendicular chord offset, or the chord angle, produce a chord length smaller than that displayed then the smallest value will be used.
This option relates mainly to shapes.
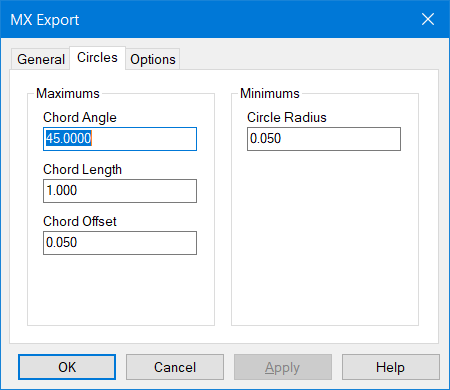
Bentley MX Arc/Circle Export Parameters
The Shape Export tab defines how n4ce deals with shapes. If the shape item is checked, additional points will be created to form these items.
Note If ALL shapes are turned Off they will not appear in the MX file.
Turn the shapes On and everything else Off and create the MX transfer.
Providing both GENIO and DXF to your client will recreate the n4ce drawing as near as possible.
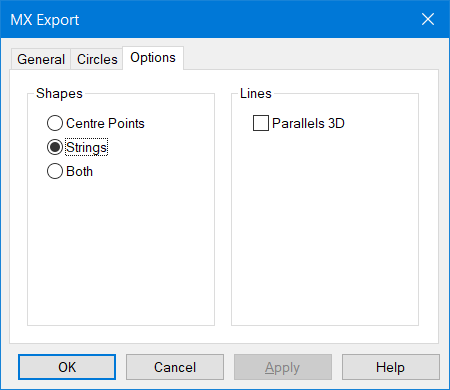
Bentley MX Shape Export Parameters
Exercise 8. Creating Drawings
We’re close to the end of this Getting Started manual. Just Drawings to cover; this is where everything is pulled together to create your final presentations. Think in terms of your paper plot, something you will pass onto your client/boss with Title Boxes and Notes.
n4ce gives you plenty of tools to express your creative skills. You now have an opportunity to put together all you have learnt so far.
-
Open the Project called Exercise 8.sdb, from the ..\Training folder.
This contains the two models we used earlier, called Heap and Heapbase. Both have been modelled. It also contains a CAD folder called User Notes. We’re going to use these to make final a Drawing.
Heap Model with CAD Backcloth Table and Text
You will see that there is a section stored in the project tree called Long. View this and note it passes through both models. - Once you are happy with the data, go to Drawings on the Project Tree. Right click and select New Blank.

Create New Drawing
There are two options available to you when you create a new Drawing, namely Blank and Template.You can start with a blank sheet of paper, adding detail like title boxes and user notes as you go along. Or, you can use an existing Drawing Template, which already contains a Title Block and Notes. It is this latter option that we will use.
Pick the Templates option and select the file offered to you in the ..\Templates folder called A0 with AiC Logo. When invited, call this new Drawing Tester.
Highlight Tester and select the Camera Icon to go into graphics. If a message appears saying that a bitmap image cannot be found, navigate to the ..\Templates folder to find Copy of AiCgood.bmp.
Note Bitmaps, including aerial photography, are not stored in the sdb file, and are externally referenced. When exporting to DWG/DXF they are not included, but their outlines are shown.
When you enter graphics, you should see the following:

A0 - AiC Drawing Template
We’re in the CAD editor, but this is slightly different to what we have used already. The tools are the same, missing one or two options.
The main difference is we’re working with units to a scale of 1:1, in Paper Space. Just look at the Ruler bars! So how do we display our surveys?
The trick here is to create View Ports. These are windows that look onto the Project Tree and have their own scale and backcloths. Let’s see how it works.
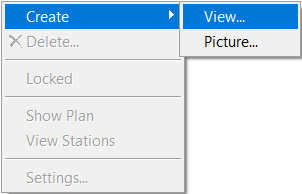
Creating a New ViewPort
Right click over the blank drawing area and select CreateàView. If a viewport exists, you will be warned.The other option here is Picture which is a bitmap. We will use this later to plot a JPG image. After selecting the View option, the Viewport Setting multi tabbed dialog box will appear. The first tab controls plotting the Frame around the Viewport and its positioning.
Press Auto to centre your images once selected. Set the Scale to 200.

ViewPort Border SettingsThe CAD tab allows you to select any CAD images that are on the Project Tree. Move User Notes to the right using the arrow buttons.
Note the Pen, Layers and Scale option.
ViewPort with CAD Selected
The DTM tab displays the available models that are on the Project Tree. Move the Heap1 folder from the Source to the Selected windows using the arrow buttons.
ViewPort with Model Selected
Images and Alignments would work in the same manner.
Note Viewports are created with their own coordinate system and scale, called Model Space. Any detail drawn in CAD is said to be in Paper Space. These will be exported as such in DWG/DXF.
After identifying the data folder, you wish to combine, return to the Viewport tab, set the Scale to 200 and press the Auto button, then select OK. The combined images will appear, as shown below.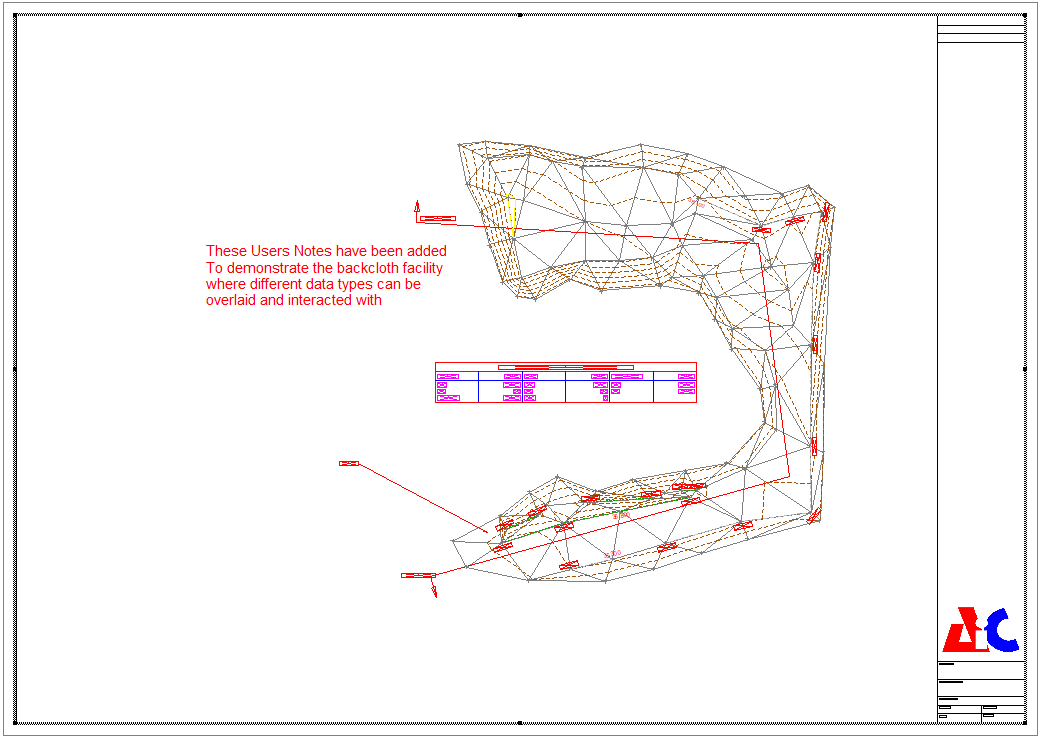
Drawing with a ViewPort containing CAD and Model Overlays - A grey border appears around the Viewport when it has focus. Try moving the corner points (see arrow cursor first) or mid-point handles to resize the box. We need to make space here to plot a section.
The Viewport acts as a clipping window. You can re-position the Viewport by dragging it to a new position when you see a 4-way arrow. If you move the Viewport, detail outside the border will be clipped.
If you wish to move the image within the Viewport, try holding the Shift key down when holding down the left mouse button and moving your cursor. A box moves indicating the new position of the image. Undo/Redo works here as well.
Note If you want to change items seen in the Viewport, return to the branch of the Project Tree containing these items and make the changes there. Changes to layer status (on/off) can be made from the Drawing. Simply right click over the Viewport and select Settings. - Go to the Tools menu and select the Grids Lines Plot option. This will plot a grid to the extents of the Viewport according to your settings.
Now try and move the Viewport. It’s locked! The Grid is drawn over the top of the Viewport in Paper Space and can be edited using CAD. Right click over the Viewport and find the Locked option. - Go to the Sections menu and select Section Plot Single and plot the Long section. You will have to recall what you learnt in Exercise 6 to do this. Hz Scale 250, Vt Scale 100.
- Finally, right click on the blank area of the screen, and select the option Create-->Picture. This time we are going to load a bitmap image, created from the 3D viewer.
- Navigate to the ..\Training folder and select the image 3D.bmp. You will be presented with the following dialog box. You can increase the X&Y Scales to 2, and then press OK.

Selecting the Bitmap Image
A grey box outlines the image allowing you to drag it to its new position.
Use the mouse and move images so that the Drawing looks like that on the following page. Don’t forget you can use the CAD tools to add hatching, notes and cut out parts of the grid.
Note the MS Window Snipping tool is a great way of copying images off your computer screen and saving them as Jpegs.
Final Drawing with Viewport, Section and JPG Image
You are now able to send this image to your printer or plotter. If you wish to create a DWG/DXF, this creates a file with both Paper Space and Model Space. The bitmap location will be shown, but the image will be missing. You need to provide bitmaps as separate files.
Individual data folders can be coloured, like Backcloths. These coloured data folders (models&CAD) can be plotted but NOT exported in a DWG/DXF file.
Summary of Exercise 8
Well done, if you’ve worked through all these exercises, but remember that this is only a fraction of what you can do with n4ce.
This final exercise introduced you to Plotting, Export and Drawings - possibly what you need most to give you confidence.
Plots can be created from the graphics environment, using the Print option in the File menu, but remember if you zoom in n4ce works on WYSIWYG and the plot/print may not necessarily be to scale.
If you want to work purely in Model Space, then do all your preparation in Models and/or CAD.
But if you want to work with Drawing Templates, Images, Partitions etc. as shown above, the only place to do this is in a Drawing, using both Paper Space and Viewports with Model Space.
For more information go to Our Website Or YouTube to View Videos.
Also, seek out our HDI Technical Notes which are installed on your computer and accessed using the n4ce Support Icon on your Desktop.

Comments
0 comments
Please sign in to leave a comment.