
Introduction
This Getting Started course is intended to cover the Survey Mapping and Ground Modelling utilities provided within n4ce, up to the Professional edition. This document offers helpful exercises to enable users to familiarise themselves with the system, putting what they have learned into practice and become more proficient and confident with their knowledge of n4ce.
The layout of the Course
These notes are intended to accompany an intensive one day course on n4ce but you should be able to use them as a basic document for a future revision, or to help you pass on your expertise to your colleagues. Most of the course is based around eight “hands-on” exercises, which are typical of the work undertaken with the system.
You will find simple graphical snapshots throughout the exercises. However, as you progress through the work, the discussion will concentrate solely on the salient points and you will not find the instructions written out in full.
Attention must be paid to the basics, as there is little point trying to grasp the more complicated tasks if the simple ones still elude you. Think for yourself!
Note Do not overlook comments - they are intended to help you!
What You Are Expected to Know
You do not have to be proficient in the use of MS Windows or its applications, to understand this document, although a little Windows knowledge would help.
There is one concept however, which should be understood from the beginning, which is the concept of Focus. When conducting yourselves in a Windows environment you always work on the object with focus. Because Windows allows you to nest and overlap controls, the control which has focus is the window which will be receiving the input from the computers mouse and keyboard. You can step between open windows changing focus.
Objects with focus will usually be shaded or highlighted in some fashion. Alternatively, they may simply have the cursor flashing next to them, indicating that the system is waiting for input from the user. Throughout this training manual, the word focus will be used many times to direct your attention to a particular object or part of the screen.
Online help is available, by pressing the F1 key. Keyword searches and further useful hints on “How to” are accessed at the press of a button.
You will be using data stored in the C:\ProgramData\Applications in Cadd\n4ce\Training folder. Also, accessed from the n4ce Support Icon on your desktop.
Feeling Comfortable with n4ce
When you run n4ce for the first time you will be invited to provide a Dongle Authorisation Code. This is an 8-character code supplied by AiC and will be stored in your computers Registry, for future reference.

Desktop Icon
On entering n4ce you will initially see a Splash screen, identifying the system you are using. There are currently five Editions to the n4ce family, namely:
- n4ce Lite
- n4ce Professional
- n4ce Designer
- n4ce Viewer
Each Edition uses the same interface but varies in functions provided. For example, n4ce Survey can view data created with Designer but can’t edit it. A “free” n4ce Viewer will fire up if no dongle is found, which may be useful for managers.
Project Manager with Initial Splash Screen
Starting n4ce for the first time, everything may seem unfamiliar, so let’s start by looking at n4ce’s basic interface and introduce you to the Project Manager.
Initially the interface looks much like any other Windows application. It has File, Edit and View menus and toolbars, with the standard New document, Open and Save icons. This is the front end to what we are going to call the Project Manager. It is designed to help make navigating through data stored in a Project Tree as simple and as logical as possible.
In many ways, it is like the Windows file manager Explorer, it shares the same code in places. At the end of each heading on the Project Tree is a folder which either contains further branches and folders or important data such as observations and adjustments.
-
Project: Untitled
A new project is given an Untitled name. Moving onto the Project Tree, the first item we come to is the Survey Data heading. From this branch are a further four branches called Stations, Observations, Elevations and Co-ordinates. Each branch contributes and stores data relevant to the project.
-
Survey Data
n4ce can store different types of survey data under this heading. It may help to think of this area as your data preparation, prior to creating a Model.
-
Stations
Survey control is stored in the Stations folder. Stations are used with observation to reduce angles and distance into point coordinates.
Stations can be extracted from the data downloaded from a field recorder, imported from an external file, manually entered on-screen or processed from survey calculations. Each method is equally acceptable to n4ce. If the folder contains valid station information, it will look like that shown below.
![]()
Station Control Grid
Stations can have one of five different status’s depending upon how they were generated. Known are imported or manually entered, Adjusted are calculated from a Traverse or Free Station, Derived are deduced from a survey but not part of an adjustment process, and Unknown are Stations whose coordinates have yet to be found. If you use our Least Squares Network Adjustment program a Lst Squares status will be displayed alongside adjusted stations.
Note A single survey control coordinate system is assumed. If a station appears more than once in the Stations folder, the first occurrence will be used during computations. Tools are available to order and mean stations, but it is up to the user to select the station that has precedence. Greyed items in grid cells cannot be edited directly. You must use the Properties (right-click menu).
-
Observations
The Observations folder stores the raw angle and distance readings making up the observed survey as recorded in the field.
Multiple surveys can be stored in a project, generally imported from LOG, EXP, DBX, DC, GT7, SDR or XML files. These can have multiple setups, FL&FR and readings to the next setup. (Pnt# is set to -99 to indicate a control reading).
Note LOG files are created by using nLogger, a stand-alone interface program specifically designed to both Download and Upload data to field instruments. When using adjustments all instrument setups should be appended under the same job folder
When observations are reduced, the calculated coordinates are displayed in grey alongside the readings which generated them. These greyed items reflect the observations that created them and can’t be edited directly. You must use the Properties (right-click menu). Ripple through update apply if you edit the raw observation data. Note the bright yellow highlighted -99 control reading, on the first Backsight reading. This also applies to the -88 RO bearing reading.
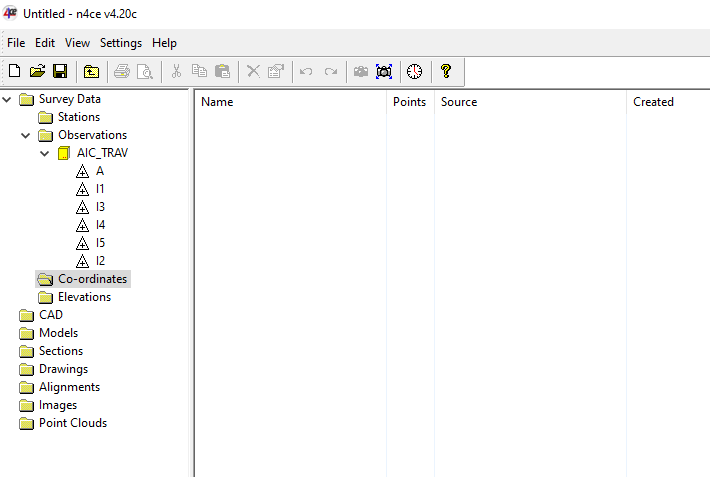
Observation Detail Grid – from Station A
-
Co-ordinates
The Co-ordinates folder contains Easting, Northing and Level (X,Y & Z) information. These can be imported from external ASCII text files using one of the standard filters built into n4ce, such as GENIO or one of the user definable filters using CSV and FIlterXYZ.ini. Another important source or coordinate data is extraction from CAD imports.
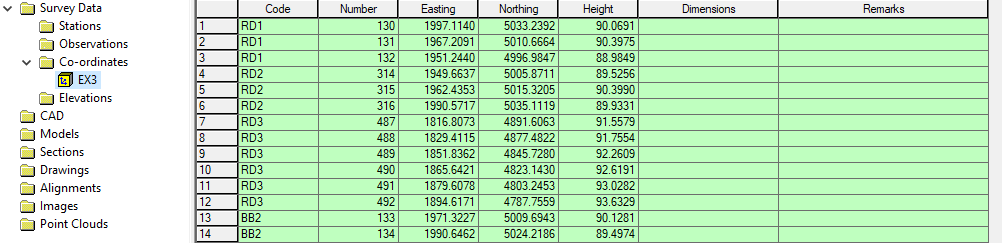
Point Co-ordinate Grid
-
Elevations
A folder has been provided for processing Building Elevation surveys.
Data can originate in either an Observations or Co-ordinates folder. A base line is selected from two plan points. Rotation and translation of the survey appears in a new Elevation folder, flipping Y & Z axes.
-
CAD
CAD detail can be created using an inbuilt editor or imported from DXF or DWG files. Sections are plotted in CAD (model space), XYZ coordinates can be generated from CAD detail and CAD is used in final presentation Drawings (paper space). CAD is fundamental to n4ce, but is not the controlling factor.
-
Models
The Models folder is used to store Coordinate data as Features and DTM Surfaces. At first glance, model’s folders appear like co-ordinates folders; but there are some very important differences which we will cover later.
-
Sections
These are stored on the Project Tree for later plotting in CAD (model space) or Drawings (paper space) with Drop Lines, Title Boxes and other detail. To pre-view highlight the section folder and select the camera Icon.
-
Drawings
Final presentation can be created on pre-formed sheets (paper space) with View Ports (model space) containing Models, CAD, Alignments and possibly Photographs. Tables, Section Plots and Notes are plotted in paper space.
-
Alignments
Horizontal and vertical alignments can be created, imported and exported in MX GENIO format. Templates can be swept out to form carriageways.
Backcloths, Copy & Paste, I/O and FilterXYZ.ini
When working with n4ce various data types can be stored in a Project including Survey, Observations, Point Coordinates, CAD, Models, Sections, Drawings, Alignments and Images, in their own data folders identified on the Project Tree.
A facility has been provided within n4ce allowing you to compare different data folders, called Backcloths, by overlaying one on another. In many cases, it also possible to snap to items in these Backcloths. Tools are available to colour Backcloths and to turn layers of on/off.
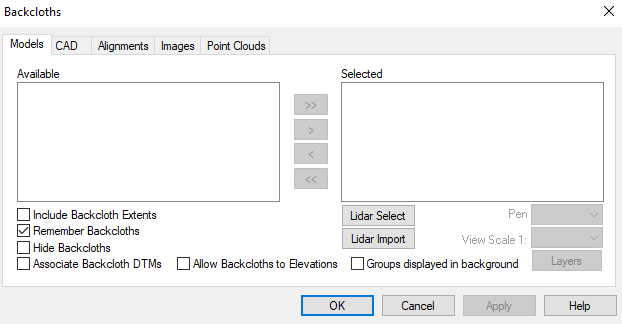
Selecting Backcloths
 Backcloths are accessed from icons, the View menu or Hot Keys [ALT+B] and can include combinations of Models, CAD, Images or Alignments.
It may be necessary to Move, Copy and Paste data either within the same Project or to another Project. These actions are normally performed in the Display Window to the right of the vertical bar and use the Windows clipboard. Drag and Drop has also been implemented. Don’t expect to copy coordinates to a CAD folder or vice versa. Other tools are available for this!
Data can be copied to and from display grids (spreadsheets), complete Models. Individual CAD layers and Observations.
When Importing, or Exporting data into and from a Project, you will be offered a selection of different file types, identified by their filename extension.
Some Import filters are hard coded and data is expected in a fixed format. User definable filters are available including CSV and a general FilterXYZ.ini.
The CSV Filter has an editor allowing you to create different filters. A display of the CSV file contents will be display at the top of the screen. A split screen Available Selection allows you to tailor your filter including Dimensions and Remarks.
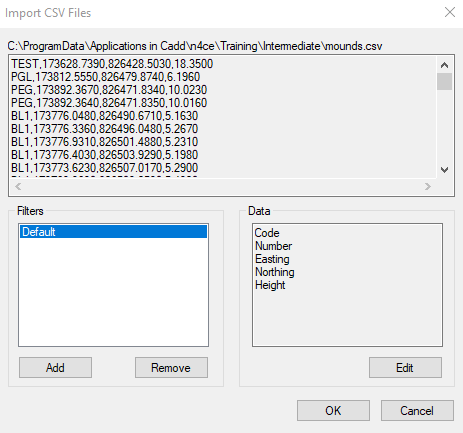
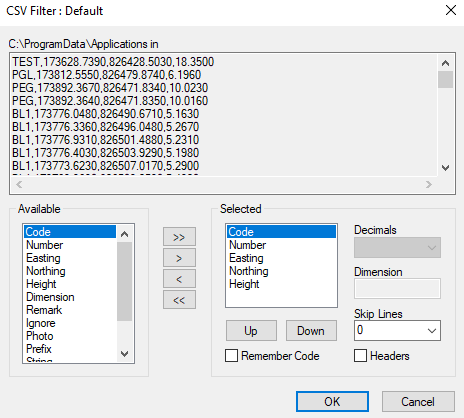
CSV Filter Editor
The FilterXYZ.ini file filters can be found in the ..\Settings folder and needs a text editor to make changes. The CSV filter has practically replaced this option, due to its flexibility.
Exporting AutoCADtm DWG/DXF and Bentleytm GENIO
When communicating between different applications, there are two main transfer formats, namely CAD (DWG/DXF) and models (MX GENIO). A new format called XML is being introduced which will ultimately replace the old GENIO format, once fully implemented by instrument manufactures..
Whilst it is possible to transfer DTMs through polygons in DWG/DXF, all coded model information is lost, being replaced by CAD elements.
Likewise, when exporting in GENIO general CAD detail, if present, will be lost. This does not include contours which are sent separately. n4ce GENIO can handle general CAD text.
The Export options are found in the files menu, as shown here.
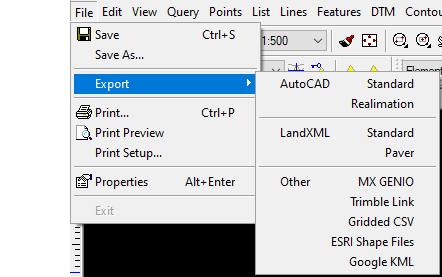
AutoCAD and Other Export Options
When selecting the Standard option you will be invited to select a filename, location for saving and DWG or DXF as file of type.
A four-tabbed dialog will then be presented allowing you to set Units, Scale, Point type, Line and DTM options. We recommend the following settings:
General Tab
Scale – used to size n4ce text in AutoCAD
Units - m unless exporting to an Architect then mm
Version AutoCAD Release 11 to 2016
2D Height – provides a ht in AutoCAD for 2D data
Points Tab
Symbols or Blocks – points in AutoCAD can only be one style
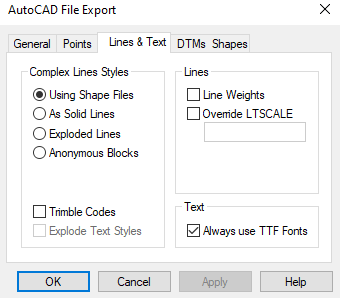
Lines & Text Tab
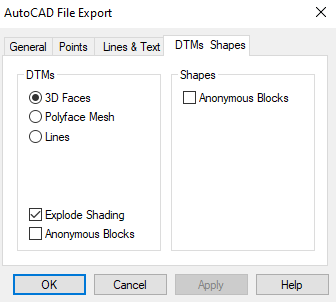
Exploded Lines – n4ce complex line styles are exploded into polylines
DTMs
3D Faces – used for machine control
A similar tabbed dialog appears when exporting to GENIO. This where you may use the Transfer code from the Code Table. Bentley MX uses a maximum of four characters in its feature coding.
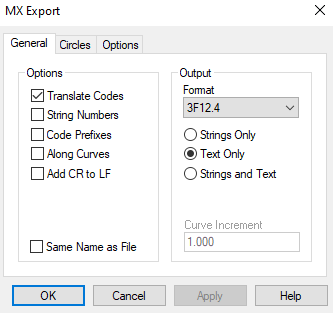
General Tab
Translate Codes– converts your n4ce codes to the Transfer code
String Numbers – increments feature with unique String Number
Along Curves – adds additional points along curved features
Strings and Text – will add text items to GENIO such as labels and heights
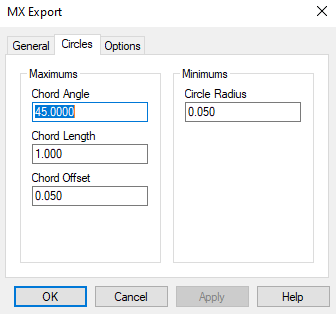
Circles Tab
Chord Length – converts circles to a polyline with short chord lengths
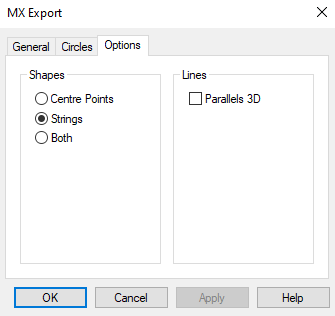
Options Tab
Strings – normal export option as linear features
Also, see Plot, Export and Drawings later, for further discussions.
Graphics Viewing & Plotting Options
It is important that you focus on a data folder before you go into graphics as this determines what, if any, editing tools are available. If, for example, you focus on the Model heading, you will see all the model folders in a Quick View.

Quick View Icons

Model Edit Icons and Menus (Pro&Des)
The View menu has an option called Toolbars, which allows you to add or remove menu icon bars.
Icon Bars are turned on/off by ticking the entry under Toolbars, but this will flood your screen with Icon Bars, including Icons that you may never use.
Like many Windows programs, you can create your own personalised Icon Bar. Simply create a New bar and drag the Icons from the relevant Commands, as seen here. You must Save Toolbars to see these in other Projects.
Plots of your Survey/Model can be created at any time with normal Windows Print options working with WISIWG (what you see is what you get). Press [ALT+S] to set the scale.
You can zoom into any part of your graphics and using the Print Preview option, plot what you see on the printer of your choice, including Adobe PDF files.
Drawings enable you to prepare finished presentations using Viewports with Paper Space and Model Space. AutoCAD DXF/DWG files can also be created at any time, using Export, which is also discussed later.
Note The images seen in this manual were created using screen grabs. Simply zoom to the detail you wish to copy, then press PrtScn on your keyboard. This puts the image of whatever is on the screen into the Windows Clipboard.
Use Windows Paint, Corel Draw or any other package that accepts clipboard images and can output these in a bitmap format like JPG or BMP.
Summary of Introduction
This concludes the brief introduction to n4ce’s Project Manager. We have discussed the logic behind n4ce’s structured approach to storing, displaying and exporting data.
This should go some way to explaining the philosophy behind n4ce and enables you to work through the following tutorials, understanding where and the best methods for editing and displaying it in a proficient manner.
Note: Copy, Cut and Paste is available to move data within and between Projects, using “like to like”. Drag and Drop is also available.
Comments
0 comments
Please sign in to leave a comment.