Creating Models
The Project Tree stores different data types and the Survey Data branch be a repository for Stations, Observations and Points. Whilst it’s possible to view these in a Control Grid or graphically, these folders are not used for serious editing or DTM creation, used to form contours, sections and volumes. This only comes in with Models.
XYZ coordinate data can be imported directly into a model, or more likely copied from a Survey Data folder. Further options using like Drag and Drop, Copy and Paste are also available, but will not be covered here.
We shall create a model of the data we’ve been using in our exercise above.
Right Click over the Model folder and select New --> Normal. The menus vary between editions.
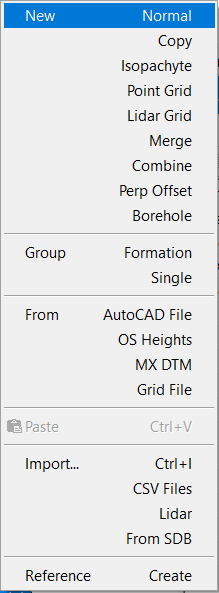
Right Click Model Menu (Des)
If you’re bringing data in from a GPS receiver using Leica DBX or Trimble Link, we advise you to bring this into a Co-ordinate folder first. Alternatively, CSV files and other XYZ files formats can be imported directly into a model.
When creating a New Normal model the following tabbed dialog box will appear, allowing you to set the Name and Scale (1250) of your model.
The Scale is important since it defines the size of the text that appears on the screen in graphics.
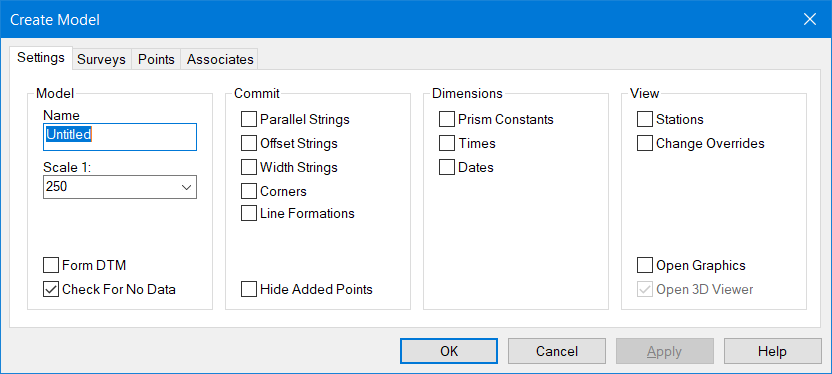
Creating a New Model
Note The button Form DTM should not be checked unless you are using the n4ce. Contours will automatically appear with the a DTM, based on the current contour defaults. These are called Quick Contours and will update when editing the DTM.
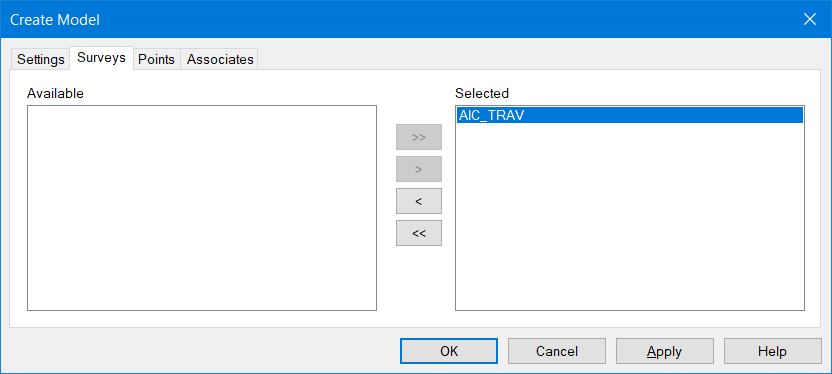
Selecting Survey and Point data for a New Model
The Surveys tab identifies survey folders under Observations in the which must have been Reduced.
In our example, we only have one called AIC_TRAV. Use the buttons in the entre panel to move Surveys from Available to Selected windows.
The Points tab is not used in this exercise since we have no Co-ordinate folders in the Project. This would be used if you have GPS imported data.
Note Having pressed the OK button, the coordinates stored in the selected Observations and/or Co-ordinates folders will be COPIED into the model. Any changes you make to these model points are NOT reflected in their source.
If the Form DTM check button was checked the triangular DTM would have be created automatically. In this case, it wasn’t.
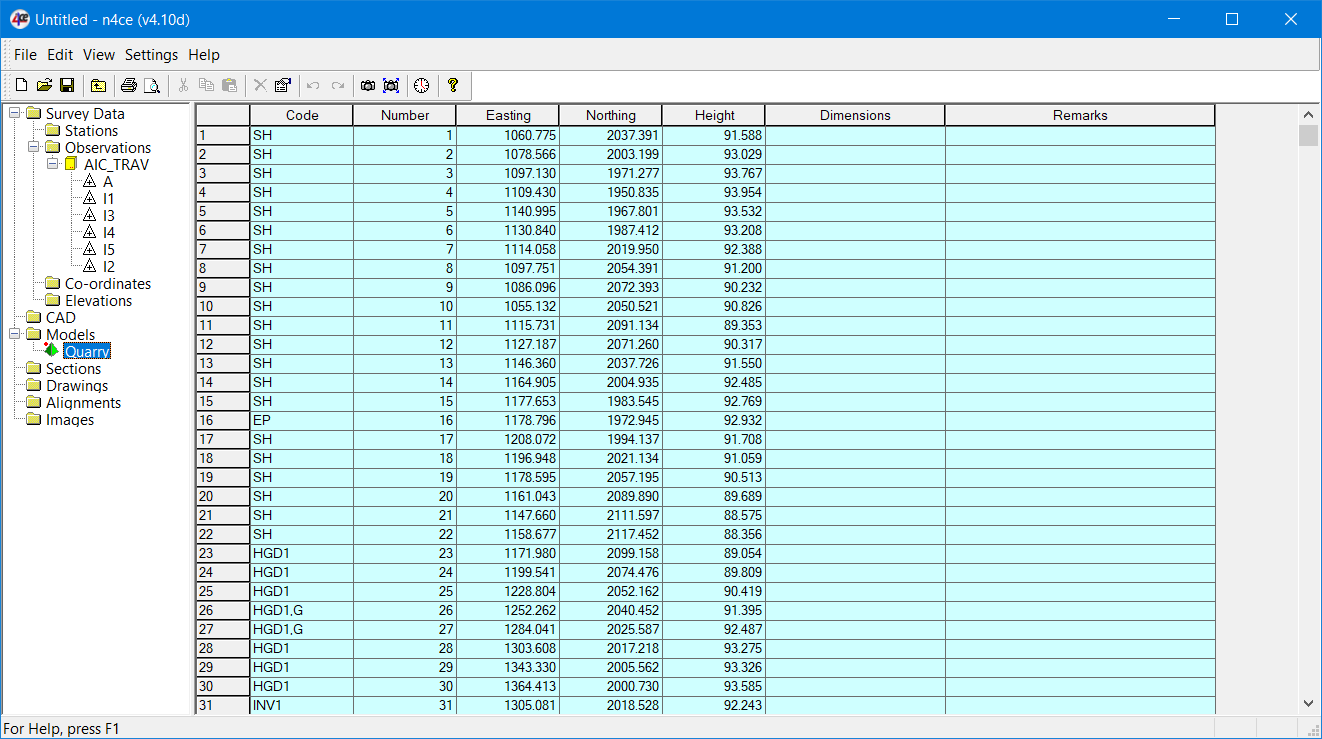
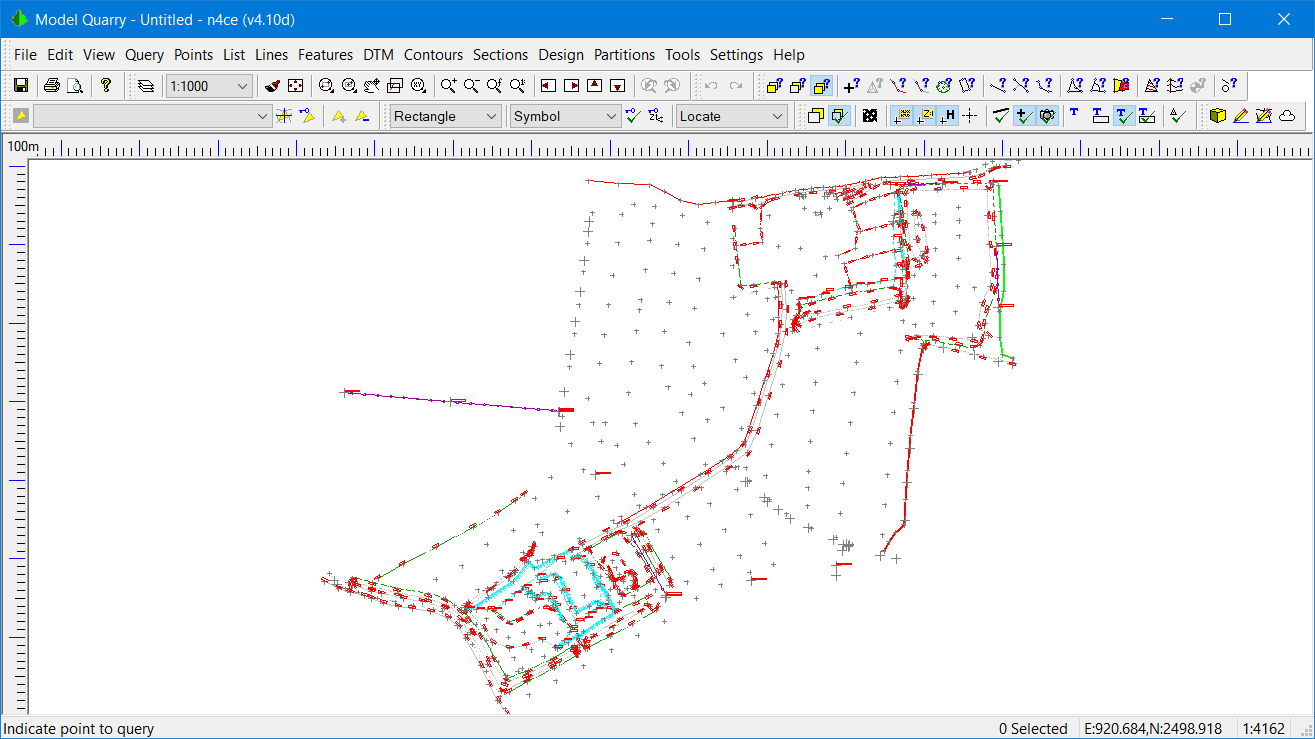
Twin Views of the Same Data - Duality of Display and Edit
The Model can be viewed as either a Model Grid (Spreadsheet) or Graphically. In the latter, there are options which provide the additional editing facilities mentioned earlier. These are reviewed in the next exercise.
There are many useful editing functions in the Model Grid, accessed by right clicking over highlighted items for group changes, or by selecting individual cells. Use right click menu options, which are column sensitive.
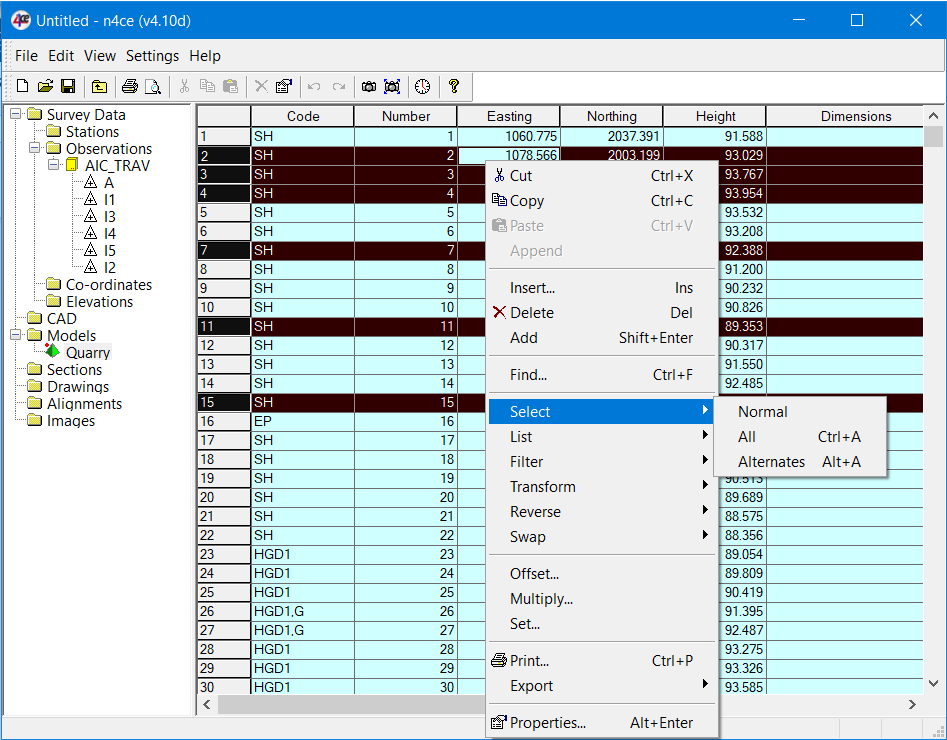
Right Click Grid Menu Options
You're working with Duality of Display and Edit. Changes in the Grid will be reflected in Graphics and vice versa. Remember that the Query Point option in Graphics can be used as a mini editor. A screen refresh [F5] may be necessary to see the changes in the Grid.
Note Remember you are working on a Copy. Changes to a model are not reflected in its original source data (Observations or Co-ordinates).
Exercise 3. Models and Feature Editing
So far, we have imported an Observations file, adjusted a Traverse and Reduced the survey. This produced co-ordinates that were viewed graphically. No serious editing was possible here apart from that available with right click menus in the Grid (Spreadsheet) and from the Query Point option in graphics.
Models are needed if editing is required in a graphics environment and for the formation of DTMs, used to produce Contours, Sections, Volumes and 3D viewing. Models are also used in Drawings, so let us create our first model.
- If you already have a Project open, click the New Project Icon
 . You will be asked if you wish to save the current project, select NO.
 - We saw in the previous section that we can create a Model by right clicking and Creating a New Model out of data stored in the Observations and/or Co-ordinate folders. This time we are going to Import XYZ data directly into a Model. A file called EX3.ACD is stored in the ..\Training folder. Right click over Models and select Import Ctrl+I. Change the File of Type to ACD and Import this file into the Project.
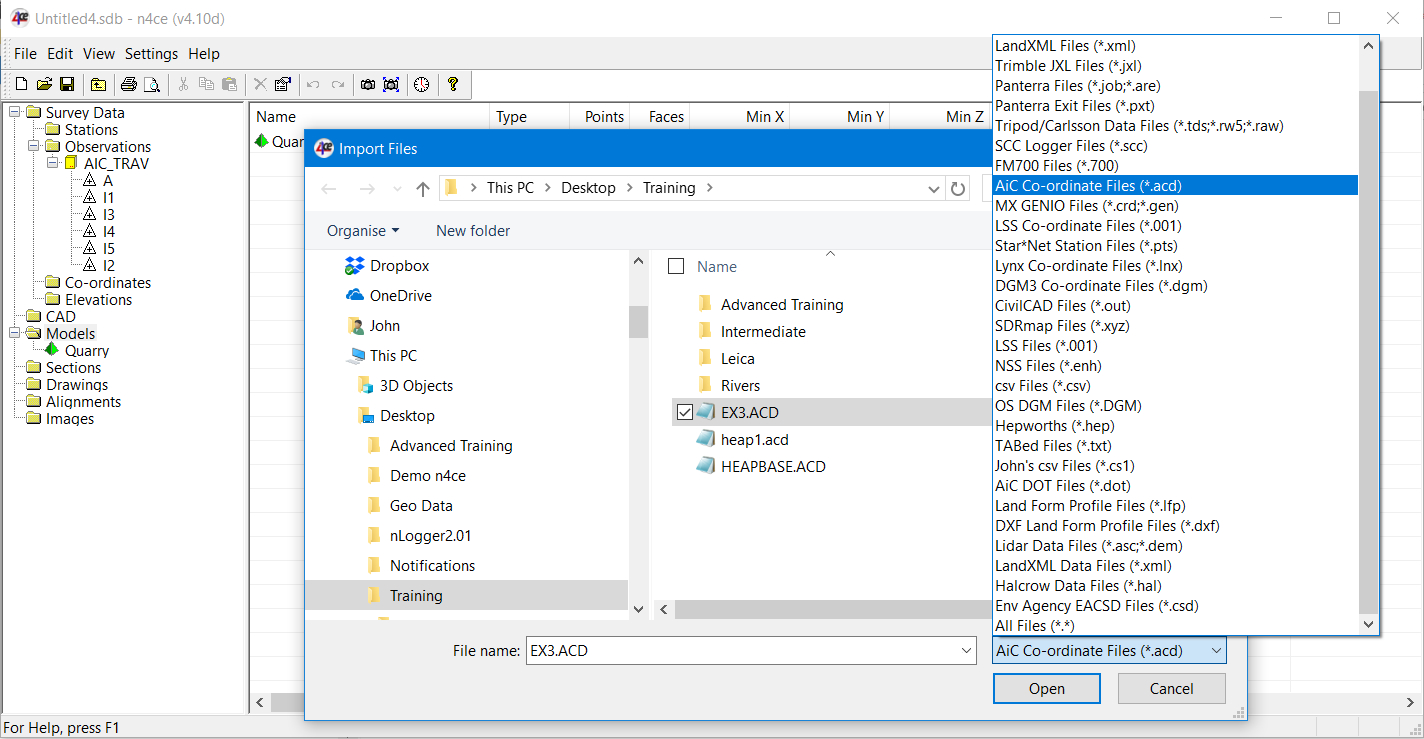
Importing an ACD File
Once n4ce has imported the file EX3.ACD into the Project a new Model folder with the name EX3 will be created, as shown below.
Note The Project name is initially called Untitled until you save the Project, by giving it a name. This is shown top left of the Project.  Select one of the Graphics Icons to view the model. Try the zoom options to familiarise yourself with the survey.
Zoom Icon Bar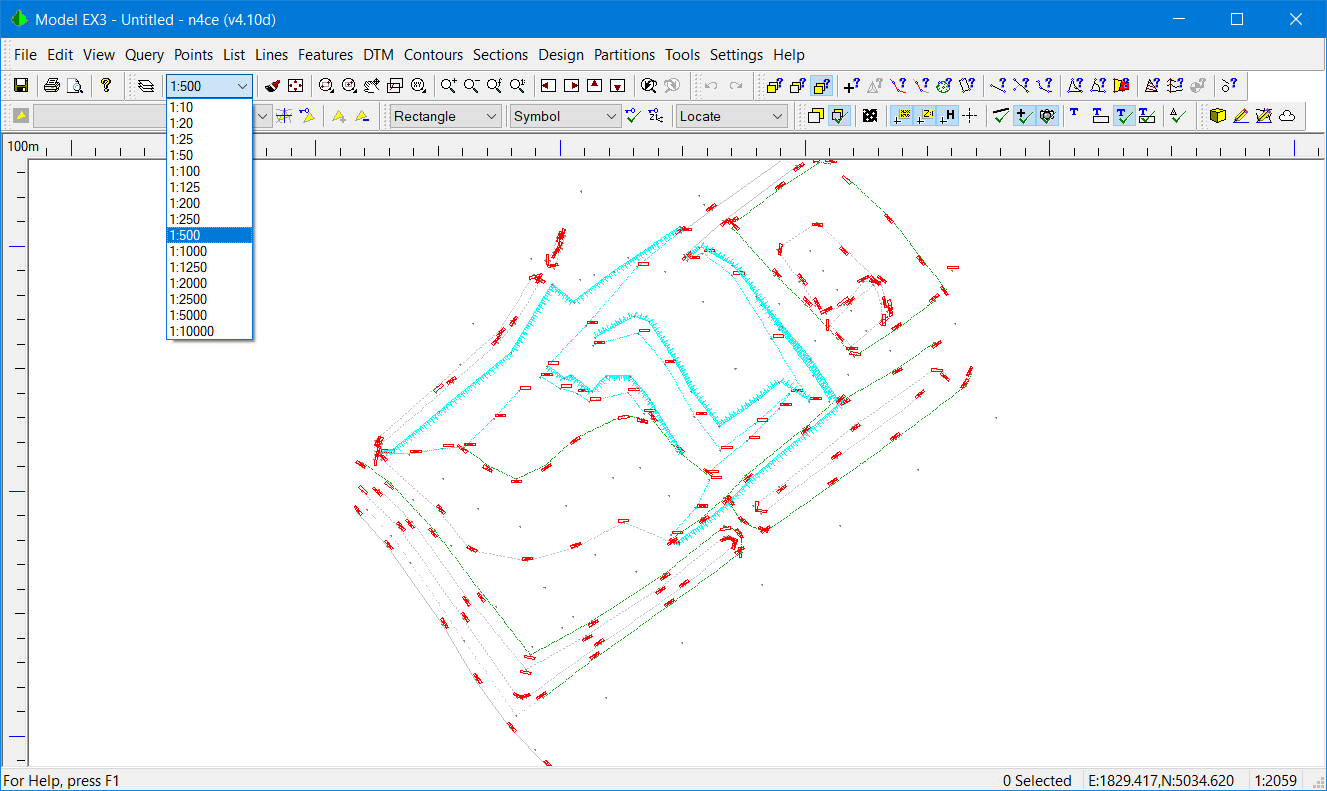 EX3 Model - Setting the Viewing Scale
Note If you don’t see the icons and menus shown above its likely that you are focused on the wrong part of the Project. You may be in a Quick View, having focused on the heading Models, rather than the EX3 folder itself.
Models provide the only interface which allows you to edit and manipulate survey data, graphically. The data you are viewing is in model space, depicted in real world coordinates.
Press the hot keys[ALT]+[V] and set the viewing scale to 1:500. This sets the reference plot scale for text.
Whilst it is possible to create plots at any stage using the standard Windows print functions, these will not necessarily be to scale.
Models are also the main source of information for depicting what is seen on plotted sheets, called Drawings. These Drawings provide the means to create Overlays and Templates with pre-prepared data like Title Boxes and User Notes, plotted to scale.
If you are missing the ruler bars, go to View-->Toolbars-->Ruler Bars to turn them On/Off as required.- We can now look at some feature editing tools. In this exercise, we will concentrate on just the BB and TB codes. So that we can see these two codes more clearly, use the knowledge you gained in the previous exercise to move the Point and Line elements of these codes to the Ground Form layer. Now turn off all the layers, except for the Ground Form and Default layer. Your Drawing should look like this.
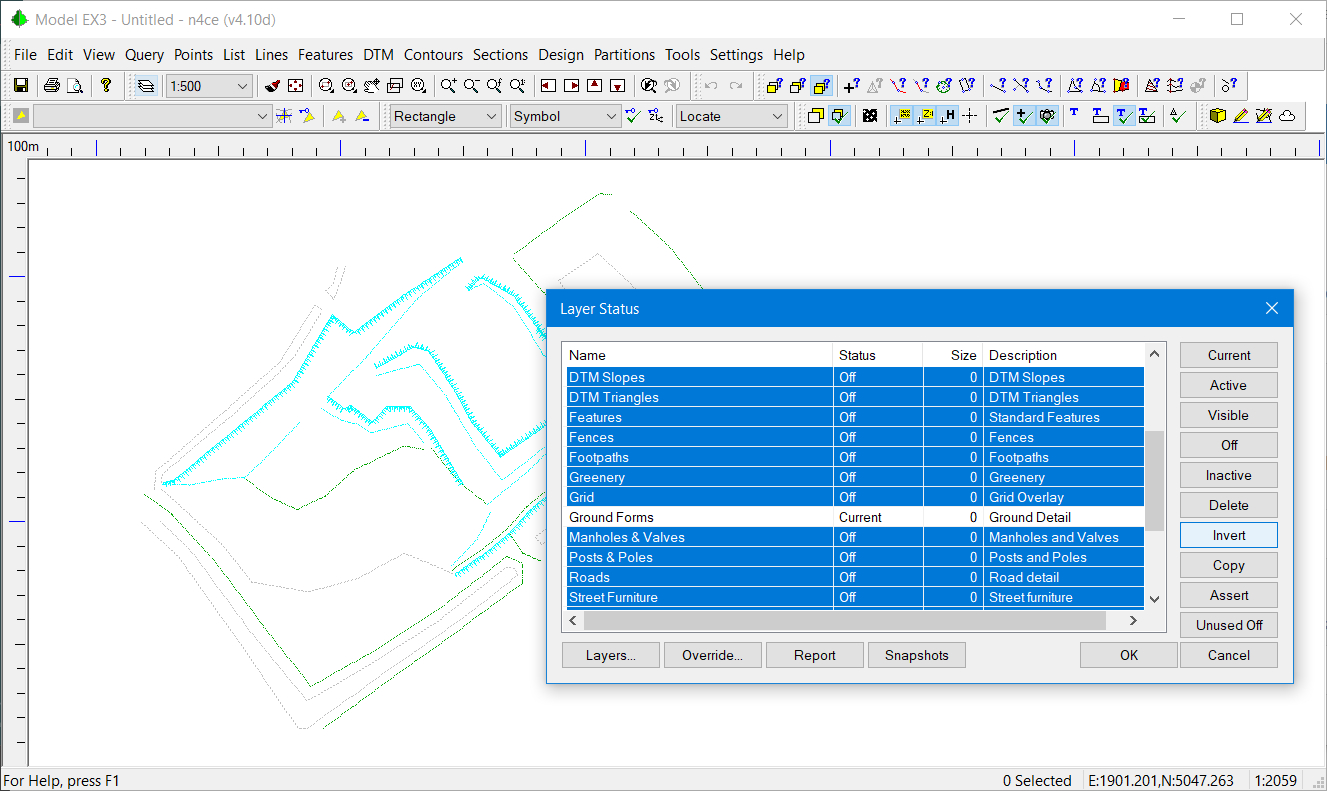
Turning Off Unwanted Layers
Note When a new Model is created, it takes the layers from the Project layer definitions and they become unique to this Model. This allows you to turn On/Off Model layers without affecting other layers with the same name elsewhere in the Project. If you create a new layer in the Project, for example for a new Feature Code, this will not be seen by existing models and must be created in each model again, if required.
If you create a layer in the Project this can be copied to an existing Model by selecting Assert option in Layers in each Model. - For this exercise, we are only concerned with editing and manipulating line features. The tools we need are accessed via Features-->Lines menu. (This menu will look different in the Lite and Pro/Des editions).
Note You may wish to visit the Report option at the head of the Features menu first. This will give you options to check for Undefined Features, Features with Warnings and Used Features. A Graphical location of individual features will be shown and tools to Code or Recode features are provided. If you visit this option, you will see INV and SH are not defined in the Code table (see below).
Line Feature Menu Showing Sub-Options and Icons (Des) - Use the Join and Close tools to make the BB string in the top right of the view continuous, as shown below.
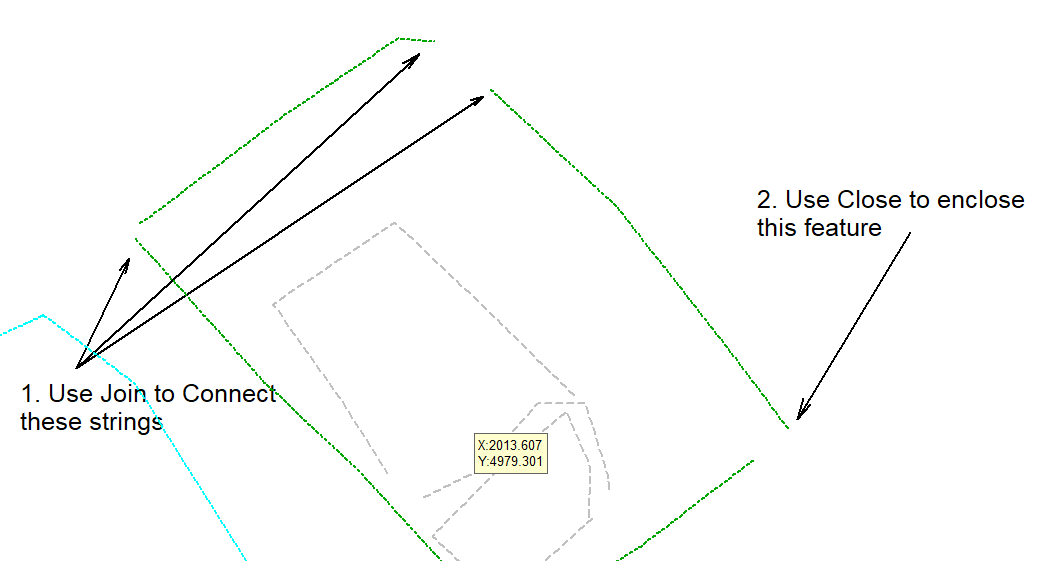
Modifying Strings
You should then end up with a continuous BB string enclosing the TB strings. Use the Query Feature option to interrogate these string features and note that the closed feature has a ,P code at one end.
Note The string you are querying will be highlighted with a large blob indicating the start of the string. Some features and text depend upon the direction of the string. Double clicking on a point in the dialog will take you into the Query Point editing mode.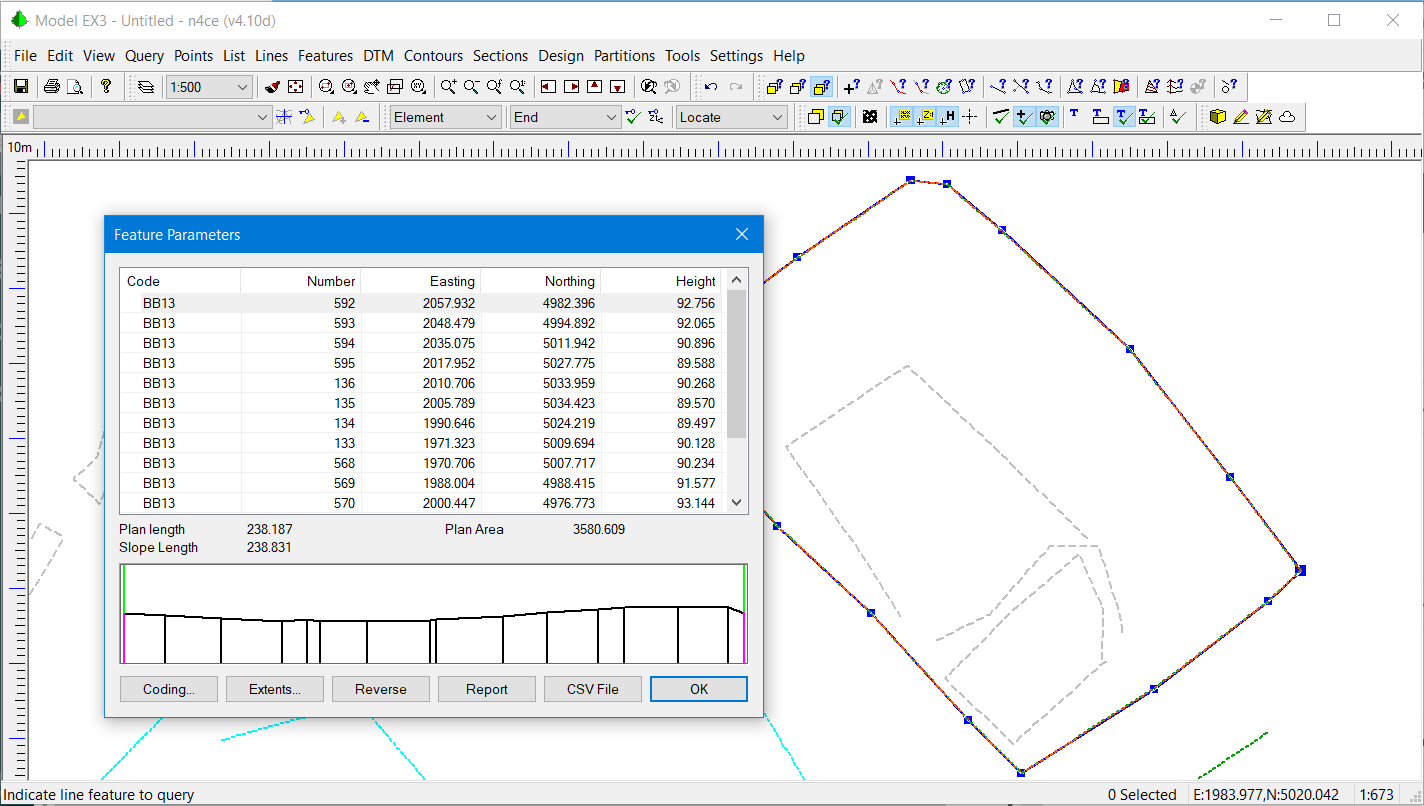
Query Line Feature - Based on what you have just learnt, edit the TB strings so that they resemble the graphic shown below. You must break the lower loop, deleting part of the string before joining strings together.
Note The options Remove and Delete in the Features menu may appear to be the same. One removes the feature leaving un-coded points, the other deletes both the feature and points.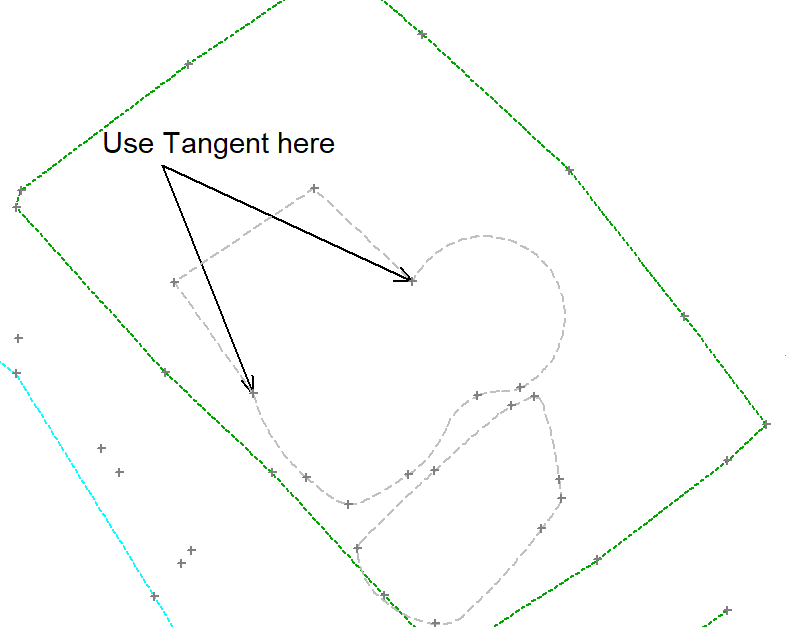
Adding Tangents to Curve Fitted Lines
Note You may also require the Apex Remove, String Break and Curve tools to complete this exercise.
Before leaving the Features menu, we will look at the Report option. This identifies features that have been used and problem areas where features have been wrongly assigned or missing from the Code Table. In this latter situation n4ce will automatically allocate the Default code to these points, so that you can see where they are.
It would be helpful if we could identify incorrectly coded points. Since we still have layers turned off, use the Layers Icon and turn them all on. Now select the Undefined Feature Codes option. You will see the following screen, with codes that have not been identified.

Reporting Undefined Codes
Your options are quite clear. Firstly, you can Define a new code or alternatively Recode the points to have a valid recognised code.
We can turn layers On/Off to suit our viewing requirements. This requires careful selection of element layers. But what if you want to turn off elements, like Point Markers or all Line Features?
Note n4ce has a powerful Override function found in the Layers Dialog or access from hot keys [ALT+F9] or selecting Override from the layers dialog
Display Override
Note the heading for DTMs. We’ll use this next in the exercise, including shading and Grids.
Summary of Exercise 3
This exercise introduced the Features menu and some of the editing options. The powerful layer override was also introduced.
Creating DTMs
n4ce has the facility to create Digital Terrain Models (DTMs). This produces a series of non-overlapping triangles to create a continuous triangulated surface.

Triangulated DTM with Shading
The process used is a modified Delaunay Triangulation, with honouring of Break Lines from Coded Features. The Code Table is very important here and you may wish to review how coded points can influence the creation of DTMs.
Note The layering of Points is important here. If they are turned off they will not be used in the creation of a DTM. Likewise, if points are given a comma X or Y code then they will be eliminated from the DTM creation process.

3D Shaded Model
The Triangulation process also checks for inconsistencies within the data, like duplicate points and crossing constraints. A summary of any inconsistencies found can be presented in both graphical and report form, as shown opposite.

DTM Formation Summary and Reporting
Note Vertical faces CAN NOT be created in this surface model (DTM). If you wish to create the illusion of a vertical face, then offset the points from top to bottom by at least 1mm. This restriction also applies to overhangs.
Where duplicate points or overlapping constraints are found, the report identifies their location and allows you to find these inconsistencies and can be identified graphically, as shown below. These are drawn in the Dedicated CAD Backcloth on a layer called DTM Errors. It helps here if the triangles are drawn with a different colour to this error plot, as shown below.
 Access to the Dedicated CAD Backcloth is made through the View CAD Icon.
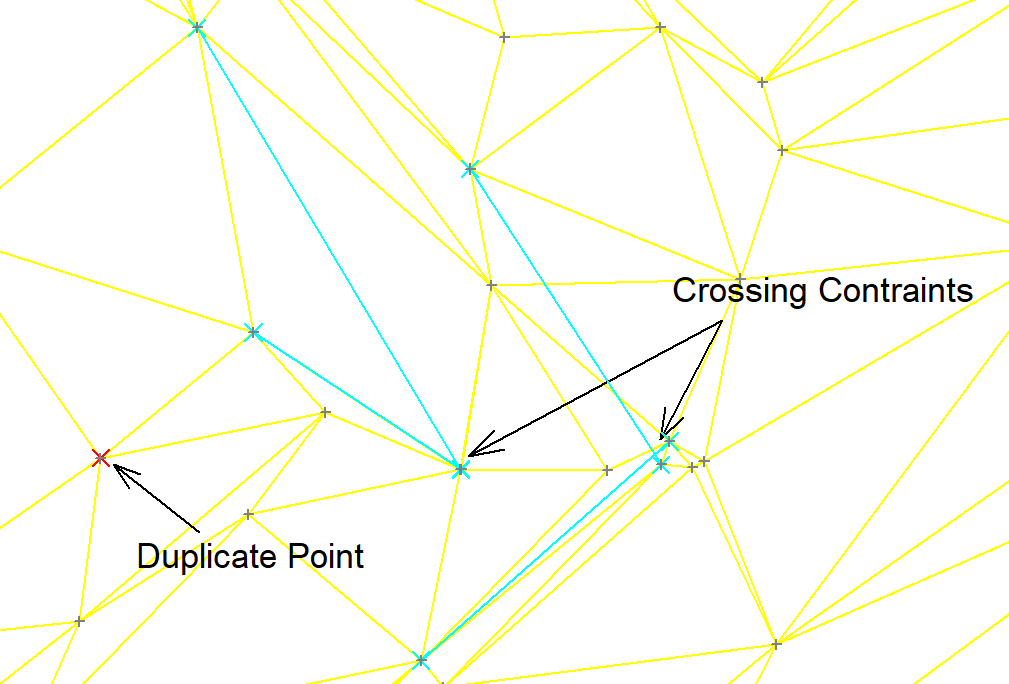
DTM Errors - Seen in the Dedicated CAD Backcloth
Further DTM editing is covered in he next exercise...

Comments
0 comments
Please sign in to leave a comment.