In this case study, we will look at recreating a proposed housing estate (now built) as part of an objection campaign, due to flooding. The proposed development was being built on a flood plain close to a small stream, with the designers incorporated flood compensation areas.

July 2012 Flooding
With its recent history of flooding, properties just north of the proposed development site experiencing flooding three times in a five year period!
Since much of the proposed design was available on the council's website, as PDF files, these were our starting point for creating models in n4ce, as the original survey data was not available.

Proposed Development of 50 New Houses - Showing Flood Compensation Areas
PDF files were first converted into JPG files and then used as a backcloth in n4ce with spot levels being digitised and heights entered manually. OS grid markings were available and these were used to orientate the data. Vectors were created for tops of banks and a stream bed.
A transformation to OS grid coordinates was then performed, using grid flick lines as control.
Note: n4ce v4.30 onwards will have a feature allowing PDF files to be worked on directly including backcloths and vector generation.
Additional ground surveys were also carried out using GPS to establish control points used with a total station to establish infill detail and floor levels of vulnerable properties.

Survey Plan Post Digitising Showing Stream and Low Area

3D Model Pre-Build
Since there has been a history of flooding, affected householders to the north of the site wished to make sure any new developments would not increase the likelihood of flooding and possibly take some flood pressure away.
LiDAR data was obtained from the EA website that covered the area of interest and from the height map created it can be seen that the ground towards the area of interest, forming a pinch point for rainwater collection.

Shaded LiDAR Map Showing Pinch Point for Small Streams in the Development Area
The exercise here was to calculate the potential quantities of floodwater and the effectiveness of a compensation area in the open field to the left of the proposed development site.
Note: Flood prediction modelling was carried out by the Environment Agency. n4ce cannot be considered a replacement for such packages as other factors beyond static volumes need to be taken into consideration. The predicted levels provided by EA modelling were used for flood levels in volume calculations.
Flood Map predications are available from the EA and are being updated regularly.
The EA published flood levels for the development site based on a return period of 1 in 2 years (62.54m AOD) to 1 in 100 years (62.96m AOD) storms. These are higher than the DPC course and some of the existing properties are in danger of flooding. See below.

Flooding on Current Site Based on 1 in 2 and 1 in 100 Year Storms
These flood maps match the recent flooding, as identified in July 2012 above. Not only are existing properties vulnerable to flooding but some on the new development as well.

Flood Volumes Tables – Existing Pre Build
To alleviate some of the flooding issues on the new development the developer proposed to raise the ground by at least 1m to the south-west of the site and introduce two retention reservoirs. The first located west of the development site will collect stormwater runoff from drains in the new development and release this at a controlled rate into the stream. The second will compensate for stormwater normally stored in the original flood plain and will be located in the open field to the left of the new development.
The exercise now is to see if the proposals will make any difference to the current flooding situation. The proposed new levels were again available in PDF files which were used as a backcloth to manually digitise and create a new final design model.

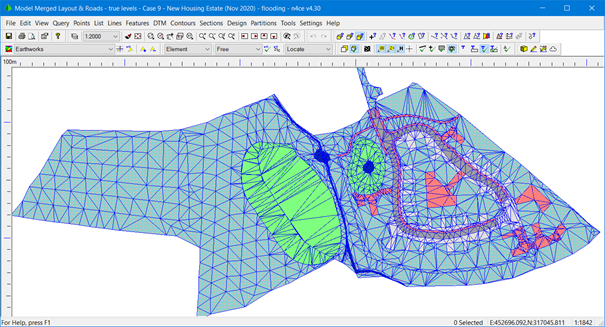
Digitised Proposed Layout Showing Proposed Flood Preventative Measures
The compensation area is to the left of the existing stream and the balancing pond to the right. Both were grouped and are shown highlighted above. The next stage is to compare the flood water volumes based on the new proposed surfaces.
Again, there are better flood modelling tools available to do this, but here we are interested in whether the proposed compensation area and balancing pond will replace the static flood water of the original site.

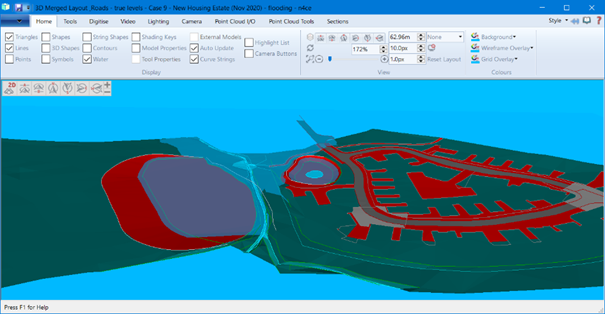
1 in 100 Flood Plane at 62.96 0n New Layout
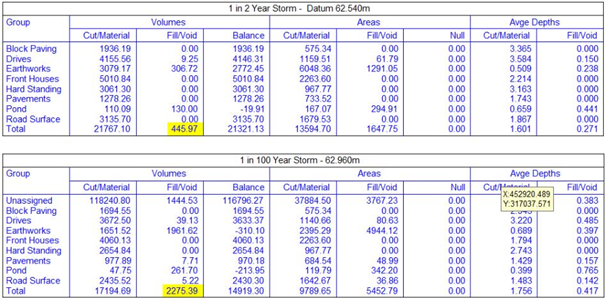
Prism volumes to a datum were used to calculate the quantities below the two flood reference surfaces from the proposed surface, as shown below.
Since we are using a reference datum plane the quantity we are looking for is Fill, remembering “what do we have to do the current surface to make it up to the reference”. These quantities are shown in yellow below.

Flood Volumes Tables – Post Build
We’re now in a position where we can compare volumes of floodwater retention for the two cases pre and post-build. They are close!
For a 1 in 2-year storm, the existing storage is 366m3 against the proposed 445m3. An excess free capacity of 79m3.
For a 1 in 100-year storm, the existing storage is 2186m3 against the proposed 2275m3. An excess free capacity of 89m3.
Based on these quantities it can be said that the new build will have a marginal influence on flooding in the local area. That’s not to say properties are safe from flooding!
But, what is the difference between design and build? With every good intention did the contractor fulfil their contractual commitment?
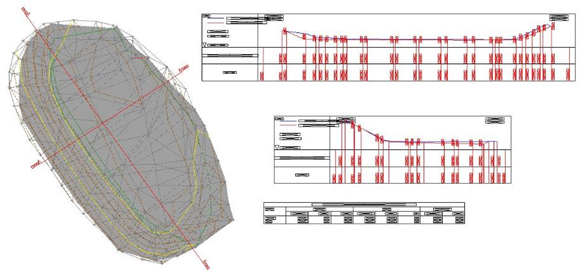
A post-build survey was carried out on the compensation area by residents, and it was found to be between 0.08m and 0.28m above design levels. As part of the build approval, it was agreed to lower the base of the compensation area by another 0.5m. This clearly was not carried out resulting in a storage capacity loss of 1015m3. This was later confirmed independently by the EA resulting in the contractor having to return back to the site and remove excess materials!

Post Build Survey of the Compensation Area Showing Differences Between Design and Build
Since the build there has been another destructive flooding incident and residents involved have carried out their own further preventative measures with the hope they are no longer susceptible to flooding. Only time will tell!
See the follow-up case study on 3D modelling of this site with a fly-through…

Comments
0 comments
Please sign in to leave a comment.