
Links for the needed files: https://www.dropbox.com/s/inglh2wd3zi73w2/Case%202%20-%20Heap%20Volumes%20%28May%202020%29.sdb?dl=0
This exercise looks at volumes from simple spoil heaps. These heaps can be made up of any materials and in this example, we’ll be working with materials being stored for composting. We will be using groups to identify individual heaps and then adding the survey to an Ordnance Survey map to generate a final presentation drawing. As part of this exercise, we will also be using backcloths.
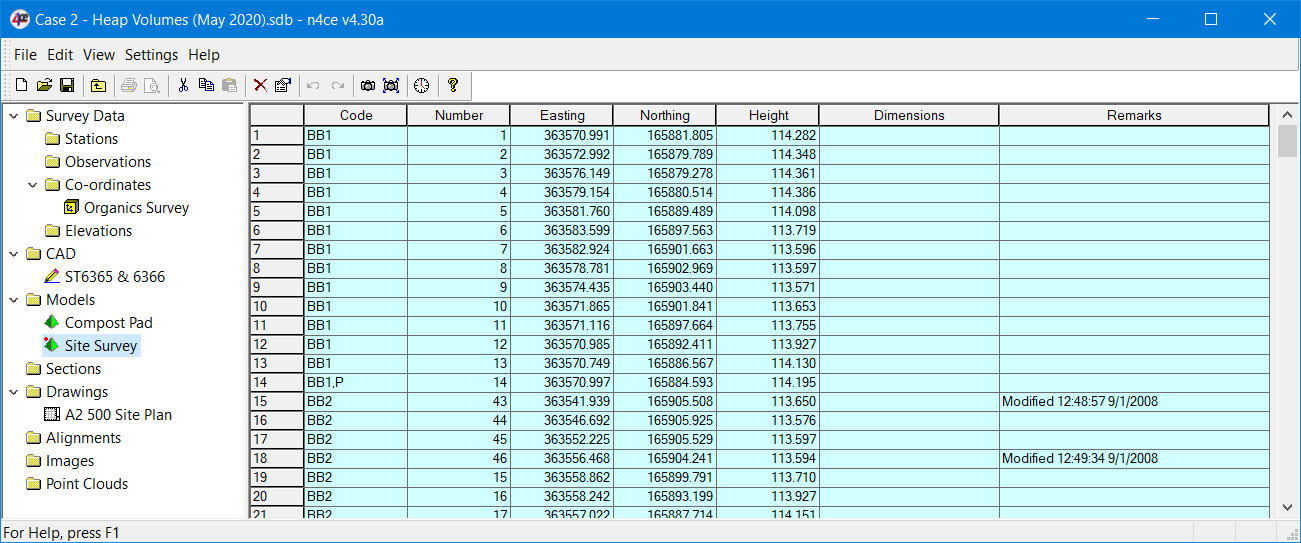 Case 2 - Project Data
The project contains a survey of four heaps made up from compost of different grades. These are clearly defined with base strings identified as BB1, BB2, BB3 and BB4. Codes are important here as they can be used to identify each heap when using the String Volumes option. We can also use groups to identify them for separate volumes quantities.
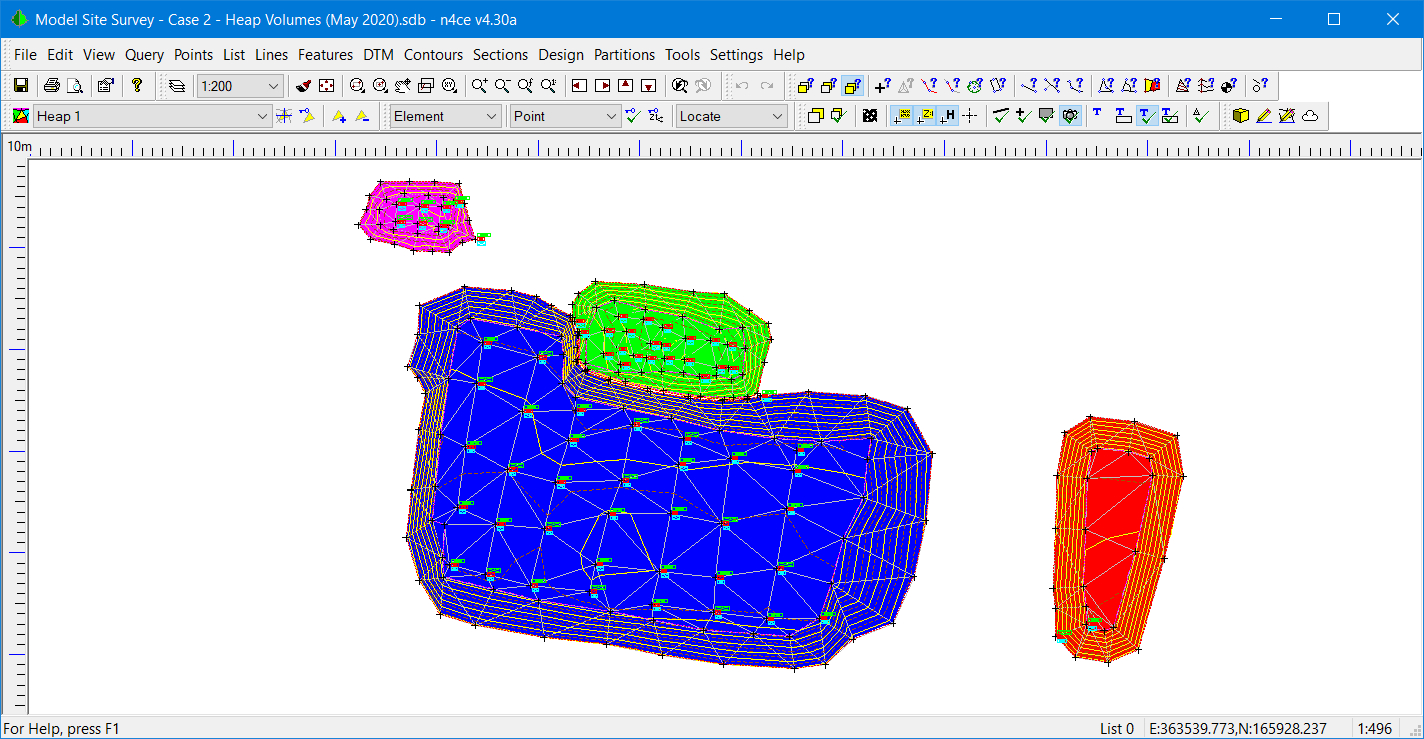
Heaps Identified using Groups
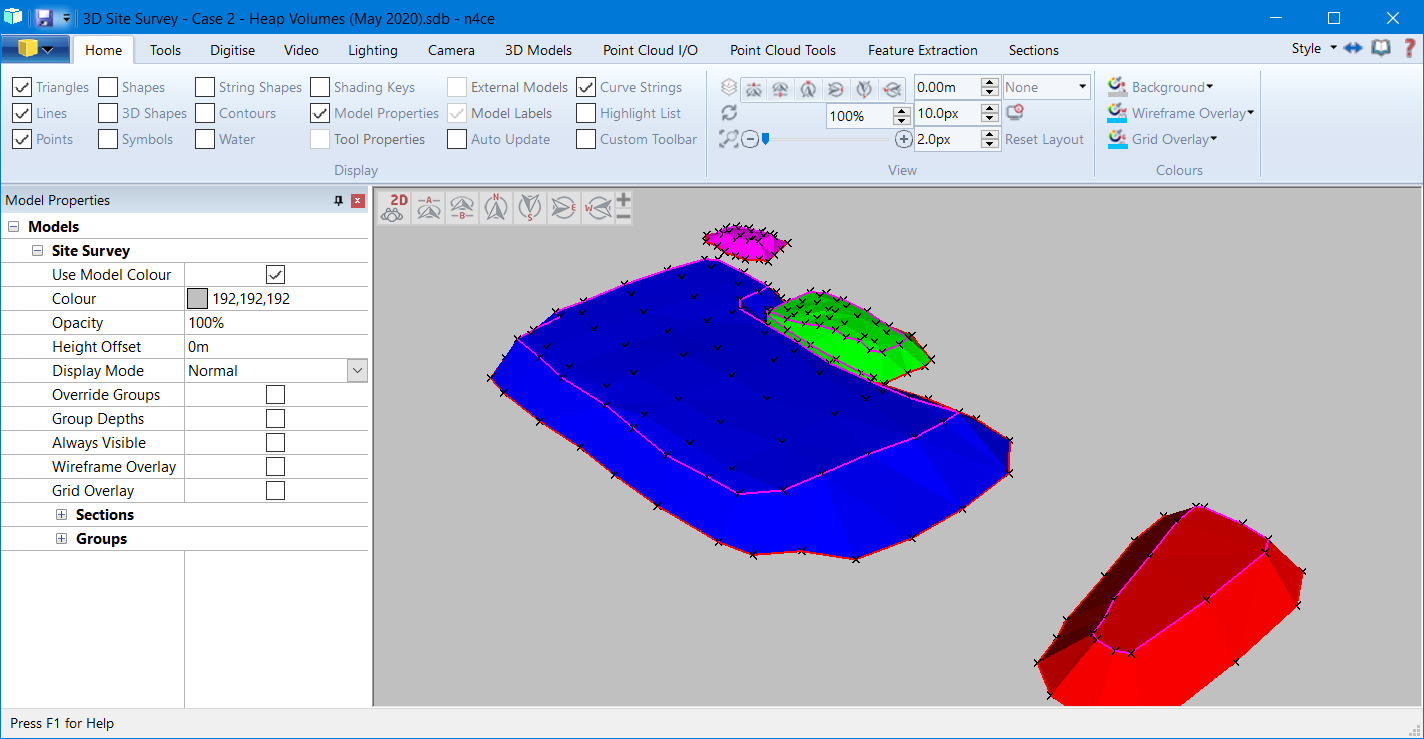
Heaps Shown in 3D
The survey was carried out and converted into National Grid Coordinates. An OS map of the area was imported as a DXF file and the survey superimposed onto this mapping.
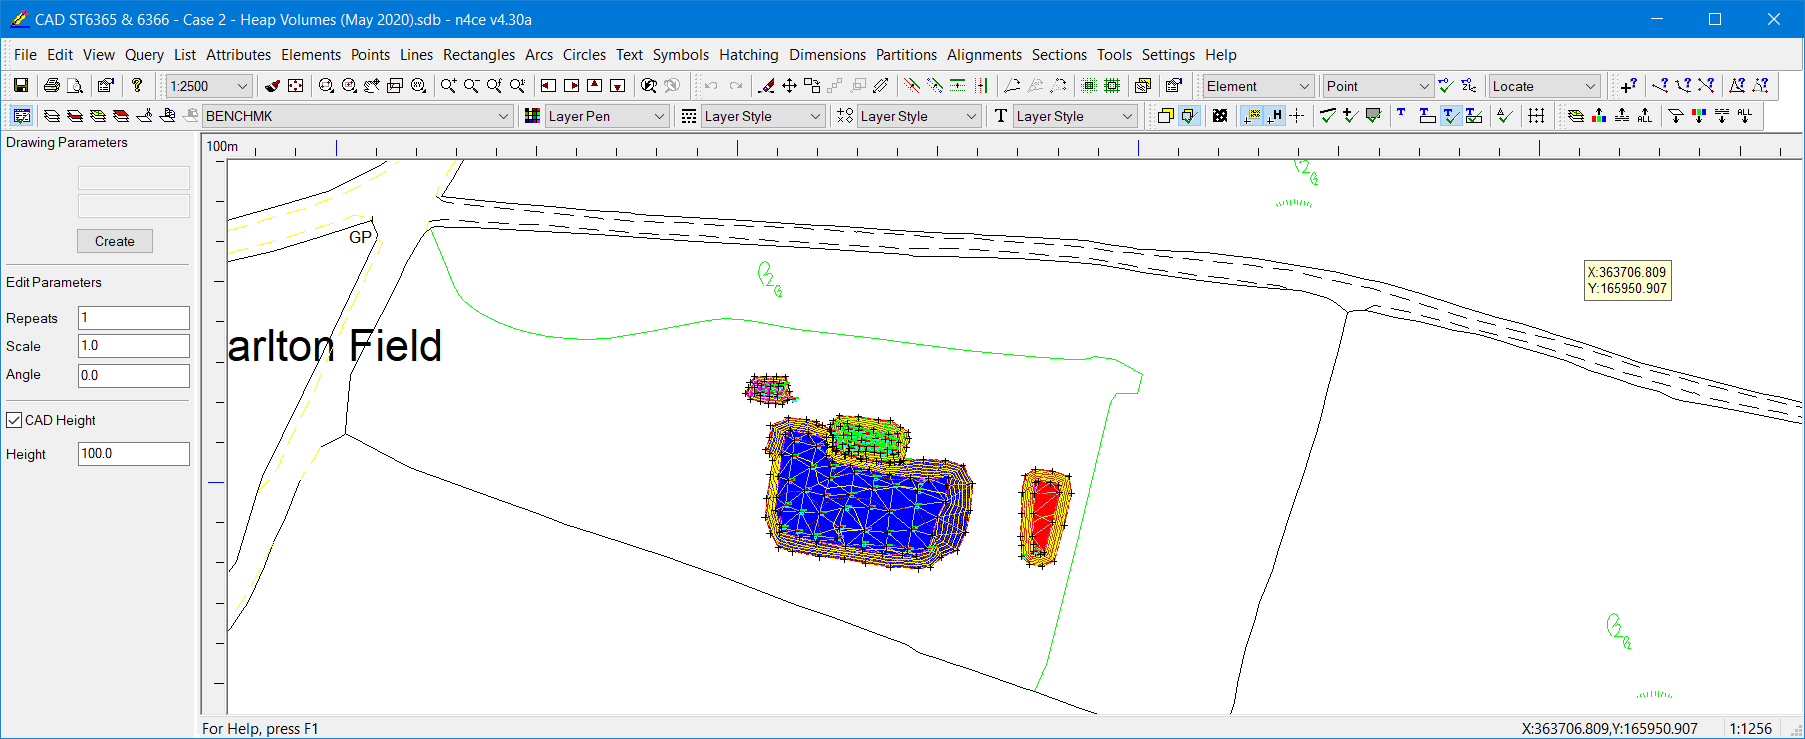
OS CAD Folder with Heaps Backcloth
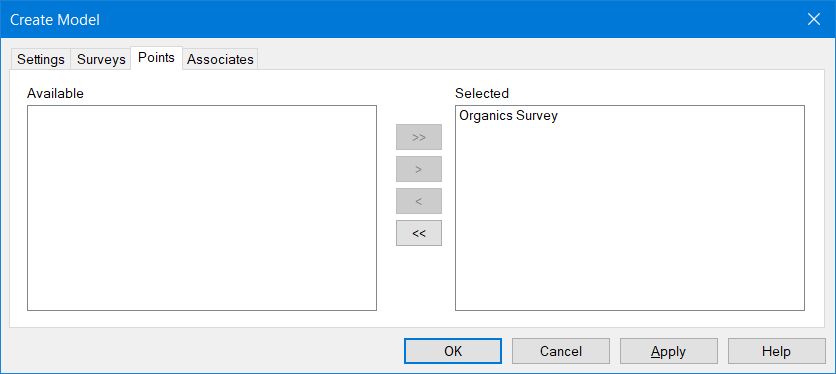
1. Open the project Case 2 – Heap Volumes. We will leave the existing data in the project and generate new data folders. Right Click on Model and select New. Call the model Heaps, scale 500 then, in the Points tab, move Organics Survey from the Available window to the Selected window using the arrow buttons. This creates a copy of the coordinates data.
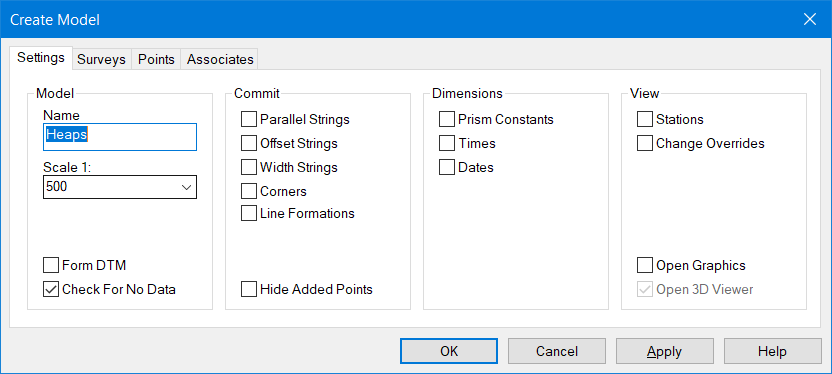
Creating a New Model
2. With a focus on Heaps select one of the camera icons to go into graphics, or simply double click over the data folder you wish to see in graphics.
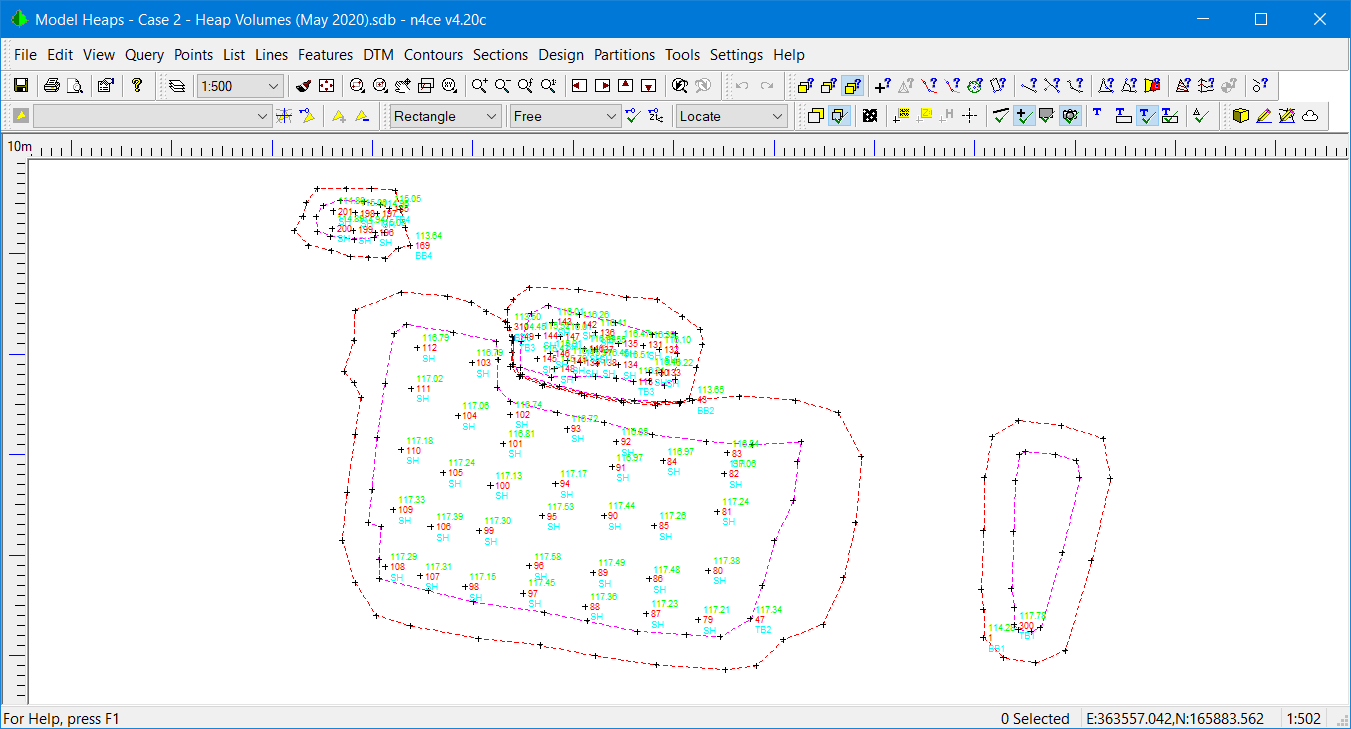
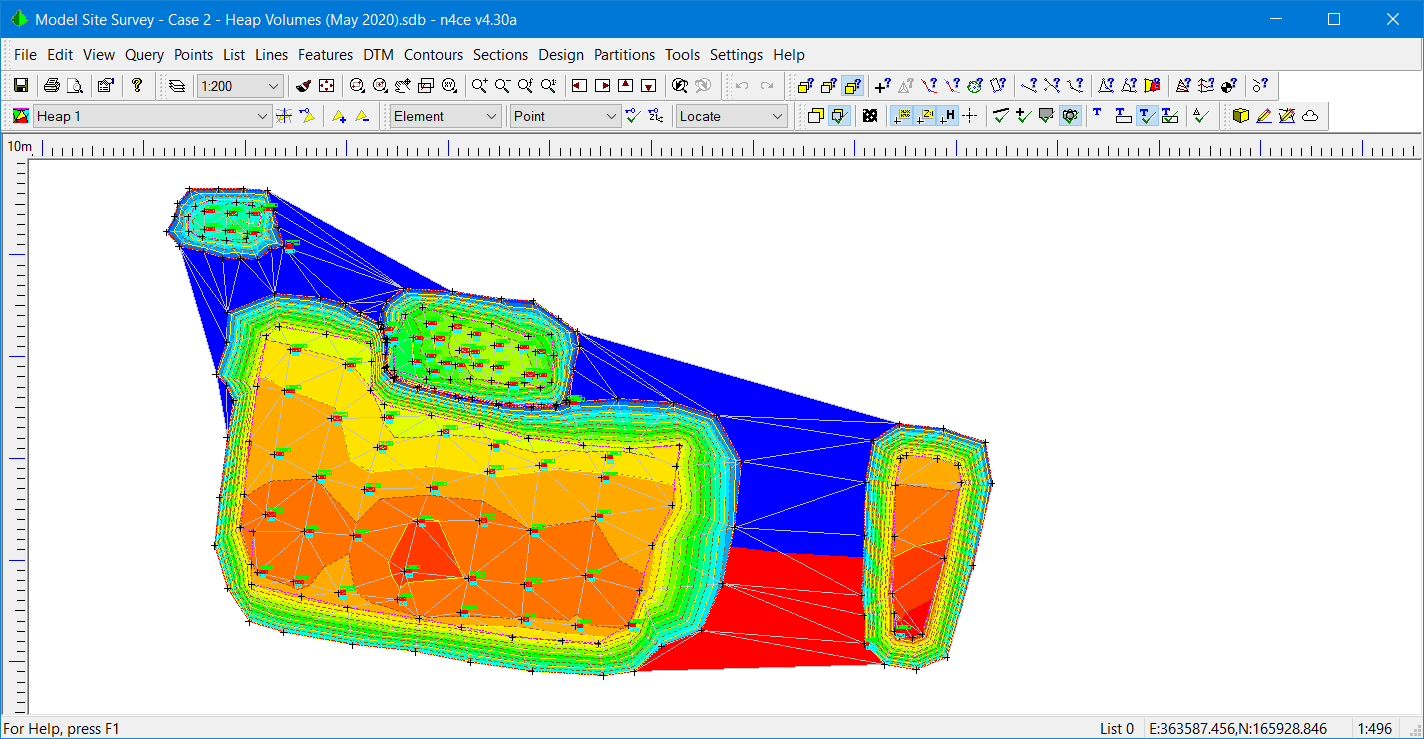
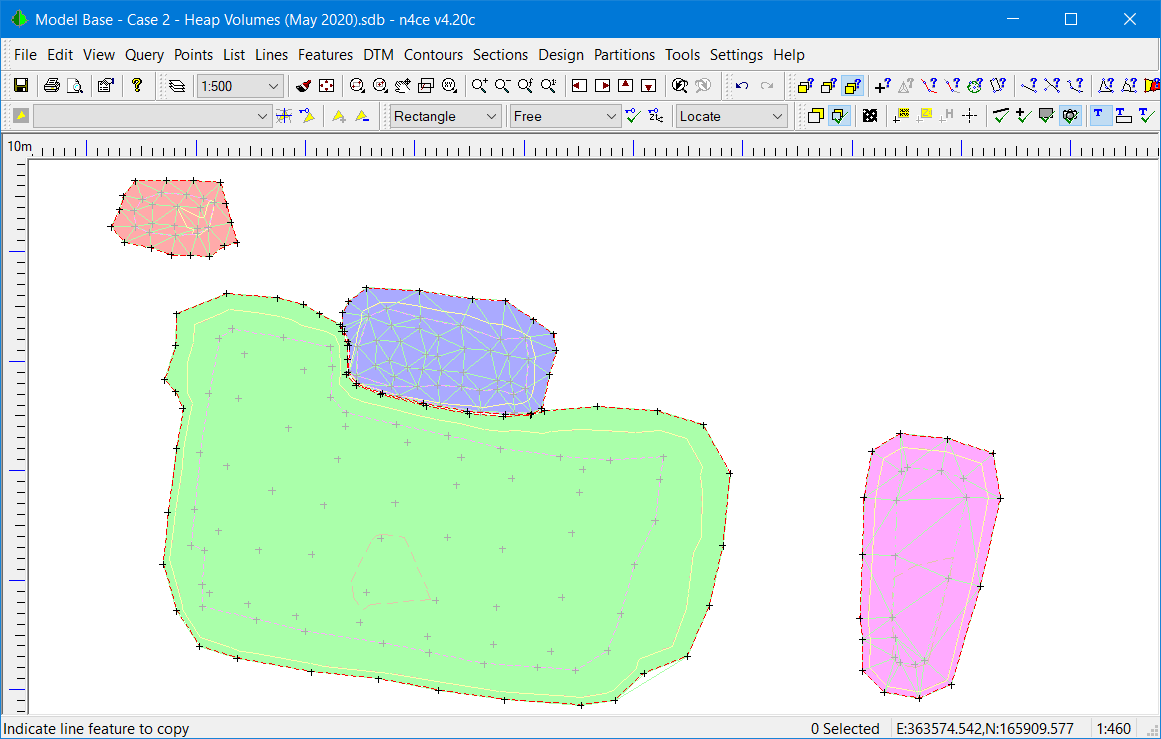
Feature Strings Identifying Heaps
3. Query the base strings of each heap using the Query Line icon ![]() to confirm each heap has its own unique string numbering. This will be used later to identify the volumes related to each heap.
to confirm each heap has its own unique string numbering. This will be used later to identify the volumes related to each heap.
4. Turn off the text either using either the blank T icon ![]() in the Display icon bar or using the layer override, ALT+F9. This will leave just the points and features on the screen. If any editing of features is required this should be done before generating the DTM. The survey was well done so no editing is required here!
in the Display icon bar or using the layer override, ALT+F9. This will leave just the points and features on the screen. If any editing of features is required this should be done before generating the DTM. The survey was well done so no editing is required here!
5. The creation of the DTM is controlled using Settings, as shown below. This dialogue also controls shading which can be added using the layer override, ALT+F9.
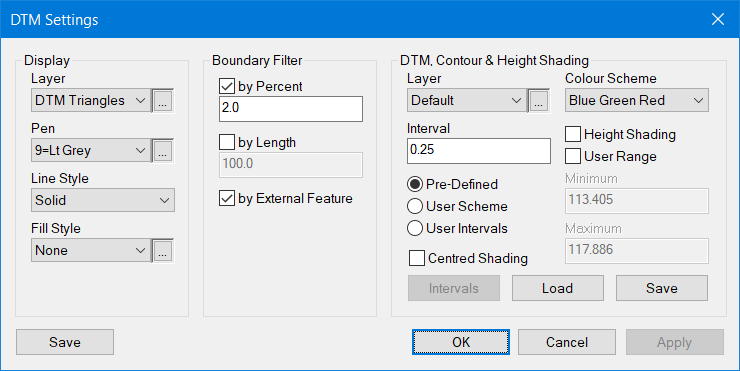
DTM Settings
The Boundary Filter removes long thin boundary triangles whilst by Length ignores linking points at distances greater than a default and by External Features removes triangles on concave boundaries that link to the same boundary feature.
6. From the DTM menu select Create Normal. This will take into account line features and use them to generate break lines or creases in your model.
7. If the Shading option is selected in the layer override you will see an overall shaded model. Select the 3D yellow cube icon ![]() to see the heaps in 3D. We now have to edit out the triangles between the base strings of each heap. This is possibly best done using the option DTM-->Edit-->Delete Line. Make sure you don’t cross the boundary feature! If you do, then use the Insert option to re-introduce the missing triangles.
to see the heaps in 3D. We now have to edit out the triangles between the base strings of each heap. This is possibly best done using the option DTM-->Edit-->Delete Line. Make sure you don’t cross the boundary feature! If you do, then use the Insert option to re-introduce the missing triangles.
Note Pro/Des users have special options here when the heaps have been grouped. See Delete Ungrouped.
Unedited Shaded Model (ALT+F9)
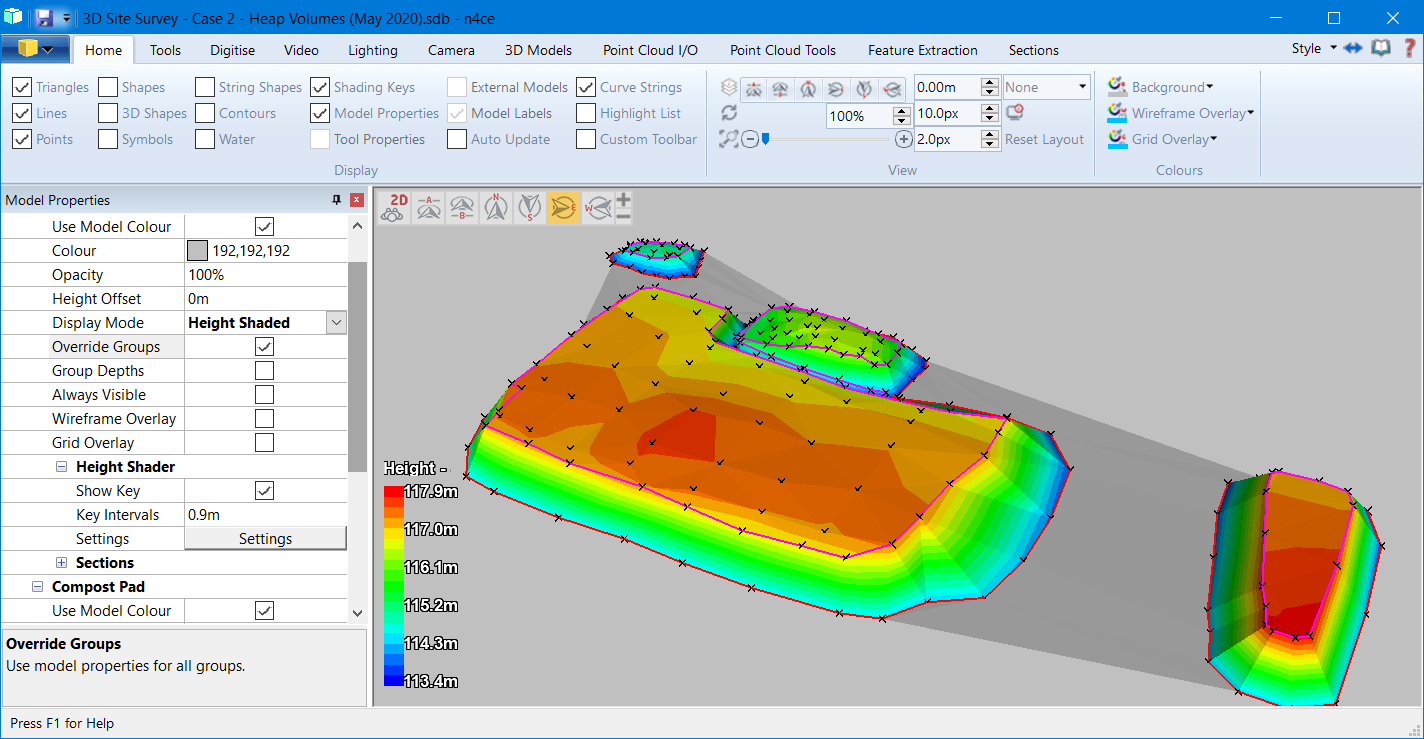
3D Height Shaded Model
8. Since we have clearly identified each heap with its unique boundary string we can now use the Volumes Strings option at the bottom of the DTM menu. When prompted select the base string of each heap. As you move around you will see the selected strings flash.
Selecting Heaps using their Base String
9. Having selected each of the base strings, right click to terminate selection. You need to provide a surface to compare these triangles too. We are looking at triangular columns of data. Since we only have the base strings as a reference we will select the Inclined Plane
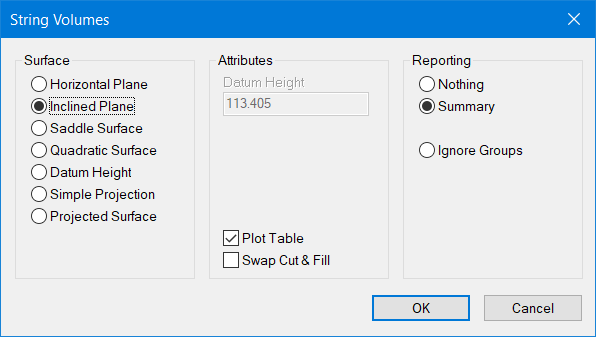
Selecting the Reference Surface to Project to
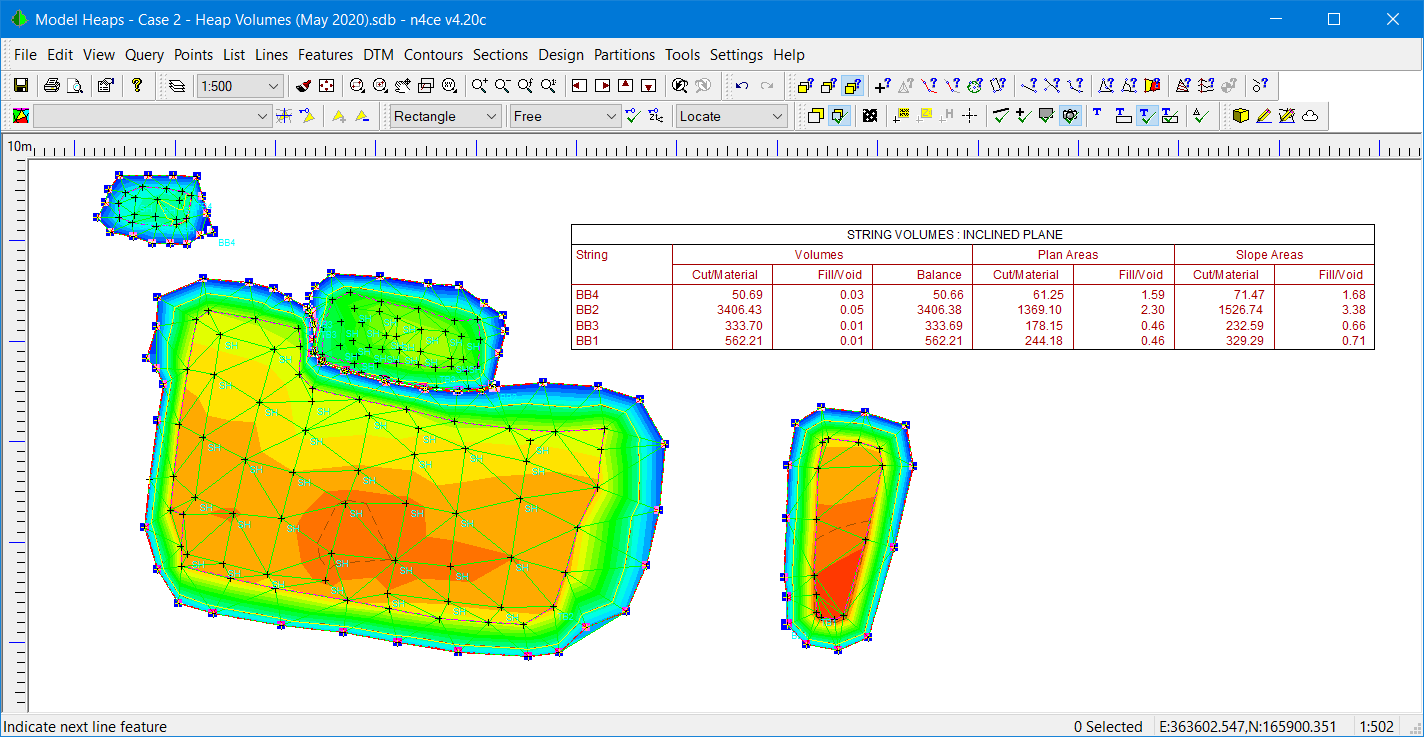
10. The results of these calculations can be plotted as a table and/or viewed in a report as shown below. A table will be plotted in graphics as shown above. Individual heap quantities are identified by the labelling of their base string.
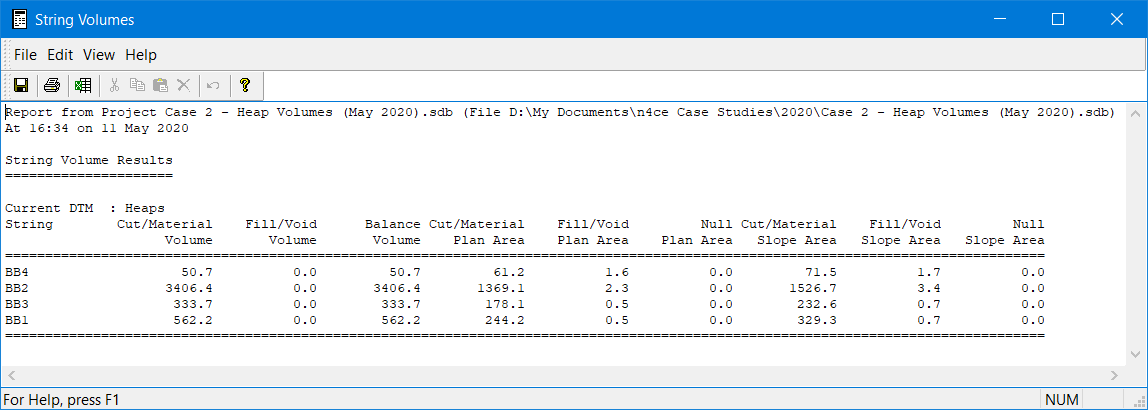
Report of String Volume Quantities
11. The above is possibly the fasted way to get heap volumes but it does rely on having well-structured data ie single strings around the base of each heap. We are now going to look at another way of doing the same calculation but this time using Groups and another DTM as a reference surface made up of the base strings.
12. Select the Groups (jesters hat) icon ![]() and select Load. A list of all the available groups will be displayed, as shown below. Move the BAYA to BAYD groups from the left to the right Selected.
and select Load. A list of all the available groups will be displayed, as shown below. Move the BAYA to BAYD groups from the left to the right Selected.
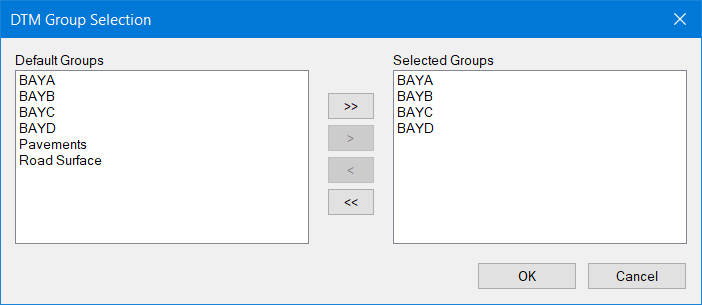
Selecting Groups
These groups can be manually generated but here we will use the pre-defined ones attached to this project. To make your own, select the Groups button.
13. Close the windows down and return back to graphics. Select BAYA as the current group in the list box to the right of the Groups icon ![]() . The yellow triangle with a plus (+) allows you to add groups to triangles, whilst the yellow icon with a minus (-) is for removing groups from triangles. Use the (+) options to fill out the small heap top left with grouped triangles.
. The yellow triangle with a plus (+) allows you to add groups to triangles, whilst the yellow icon with a minus (-) is for removing groups from triangles. Use the (+) options to fill out the small heap top left with grouped triangles.
14. Change the current group and repeat the operation with the remaining heaps. The boundary option is particularly useful here (Pro&Des). Turn off the shading (ALT+F9) to see the grouped triangles. Also view the model in 3D to see the groups. Only the foreground colour with a solid fill.
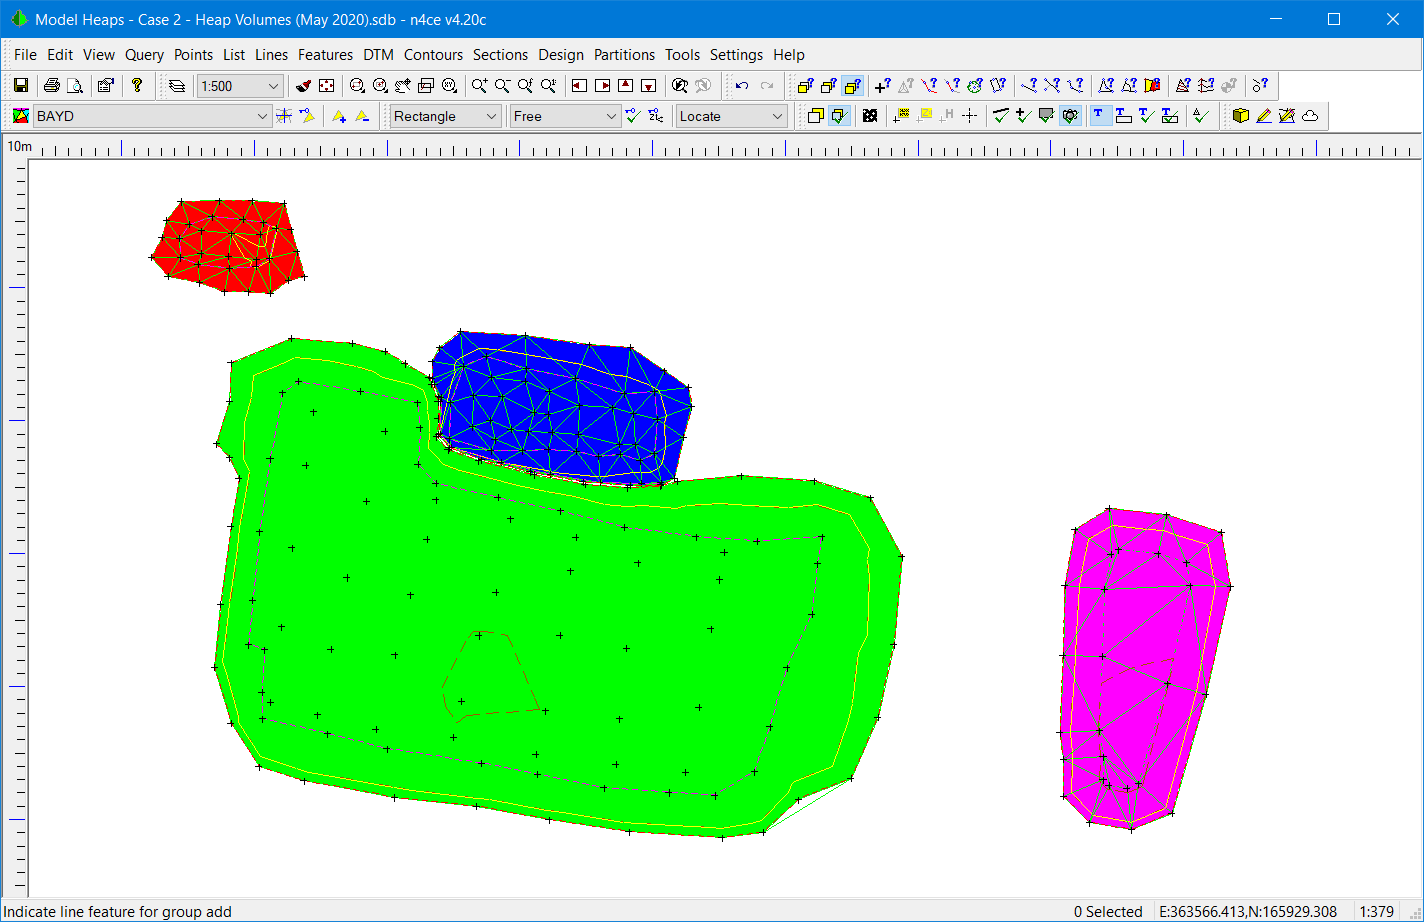
Grouped Models
15. We now have to identify a reference surface. In this instance, we can use the heap base strings again making a copy and then forming a DTM. Here we will use the Copy tool in the Features menu.
16. Firstly, return back to the project and create a new model calling it Base with a scale of 500. Double click on this folder to take you into a blank graphics screen. Select the Backcloths icon (ATL+B) and move the Heap model from the Available to the Selected
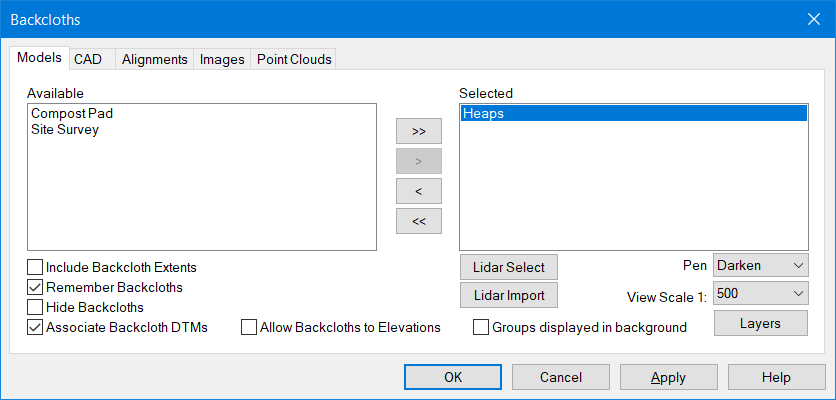
Selecting Backcloths
17. You have the option to change the colour of each backcloth and use a shortcut button to turn layers on/off, including the Dedicated CAD Backcloth. We’ve “Darkened” the image as seen below so we can clearly see the strings that we are copying.
Copying Strings from the Backcloth
18. Use the option Features Lines Copy Backcloth to make a copy of the base strings of each heap., as shown above, then turn off the backcloth.
19. Using the DTM-->Create Normal to create a DTM from the heap base strings. If you select the 3D icon you will see the heaps and the Heap and Base models together.
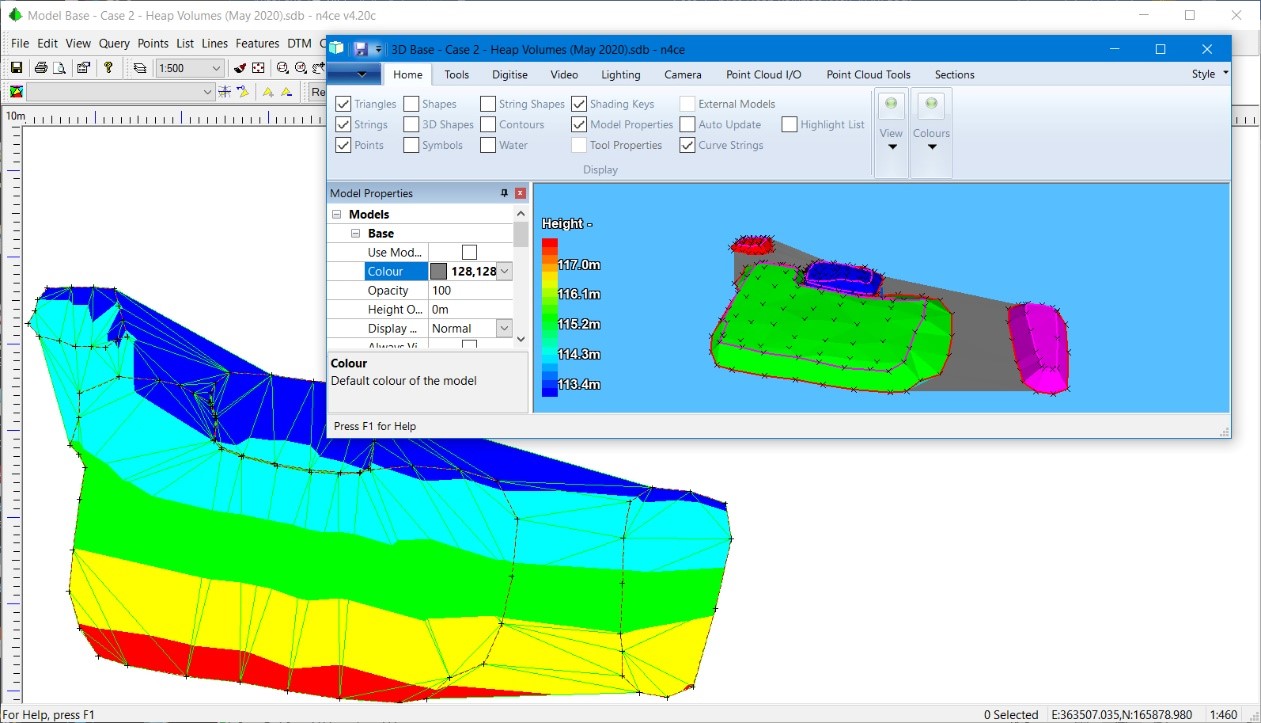
Base model and Combined Heap & Base in 3D
20. Close the Base model and return graphically back to the Heap Turn on the groups (ALT+F9) if necessary. Now select the Volumes Prism option from the bottom of the DTM menu. Select the Projected Reference Surface.
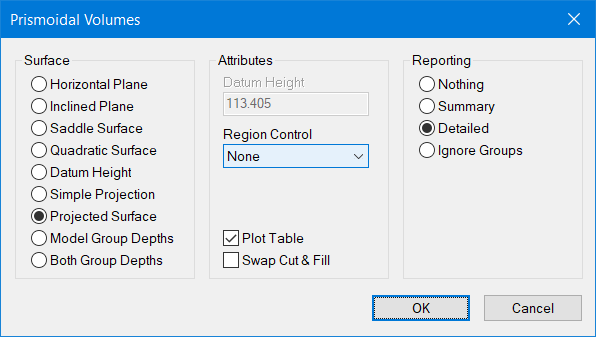
Selecting a Reference Surface for Prismoidal Volume Calculations
21. After selecting the OK button you will be invited to select a reference DTM. Select Heap, as shown below.
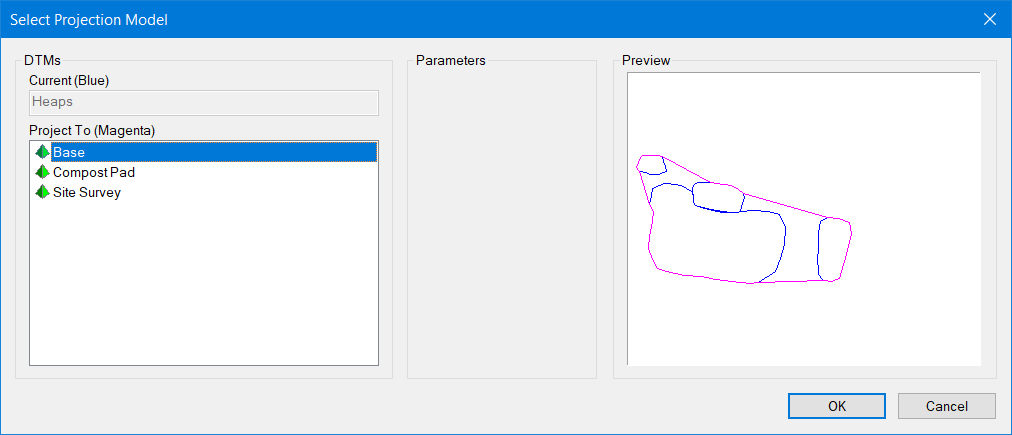
Identifying the Reference DTM
22. The results will appear in both a Table and Report. These can be compared to the volumes previously calculated using strings, as seen below.
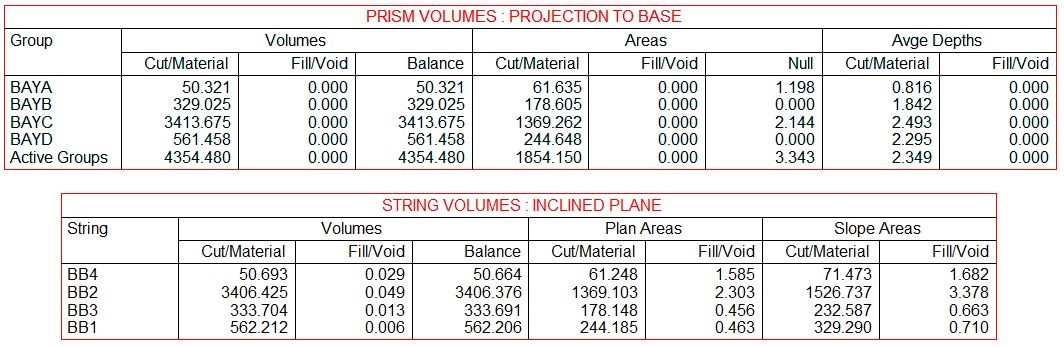
Volume Results Comparing Strings vs Projected Surface
23. The beauty of doing these calculations by groups is they can be more clearly identified and the results are generally more accurate, especially if the ground the heaps fall on are undulating and of course, it gives you an overall quantity, which is generally required. Note there are small differences, but not significant!
Summary of Case Study 2
As you grow in your confidence and the results produce in n4ce you can use your own judgment as to which method of calculation is the most expedient or most accurate. But remember the results are only as good as the source data which needs to be organised. Also look at Case Study 3, which introduces you to general volume calculations including group depths and our sign convention!
Comments
0 comments
Please sign in to leave a comment.