
Links for the needed files: https://www.dropbox.com/s/agdmbgmu6vko3de/Case%201%20-%20Slab%20Dipping%20%28May2020%29.sdb?dl=0
This exercise uses levels measured on a floor slab to determine height differences and volumes of the material above and below a given datum level, a process sometimes referred to as dipping. In this example, we’re working with a sub-base and there is a tolerance of +/- 10mm from the desired level, so the contractor is interested in identifying highs and lows outside of this tolerance.
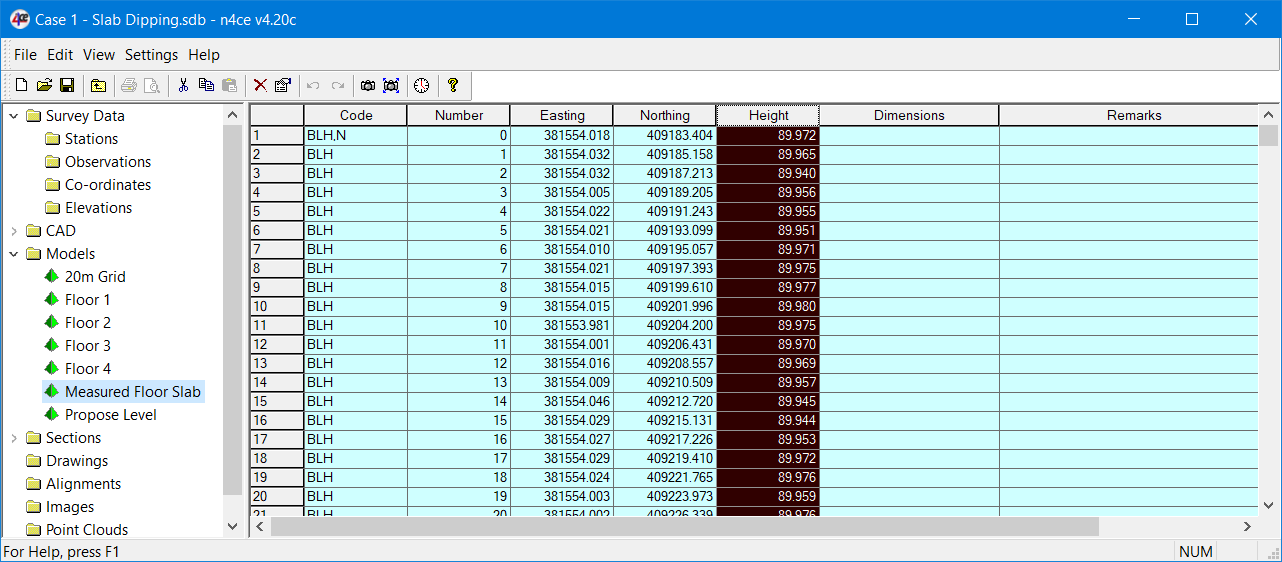
Floor Slab Sub Base Levels
Sub Base Levels and Grouped Final Design Slab (160mm Thick)
The floor slab has a final level of 90.13 and a construction depth of 160mm. The contractor has to lay the sub base to a level 89.97 +/- 10mm. We need to identify both graphically and provide quantities where the sub-base fails to meet these tolerances.
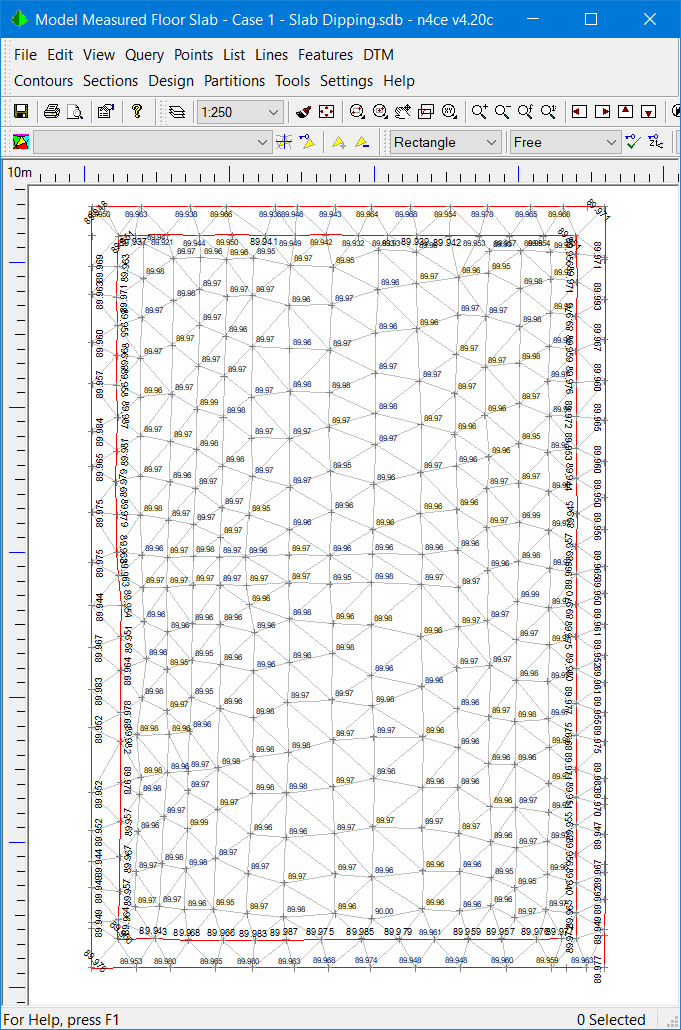
Taking a section through both the proposed Level and Measured Floor Slab base provides the following visual check.
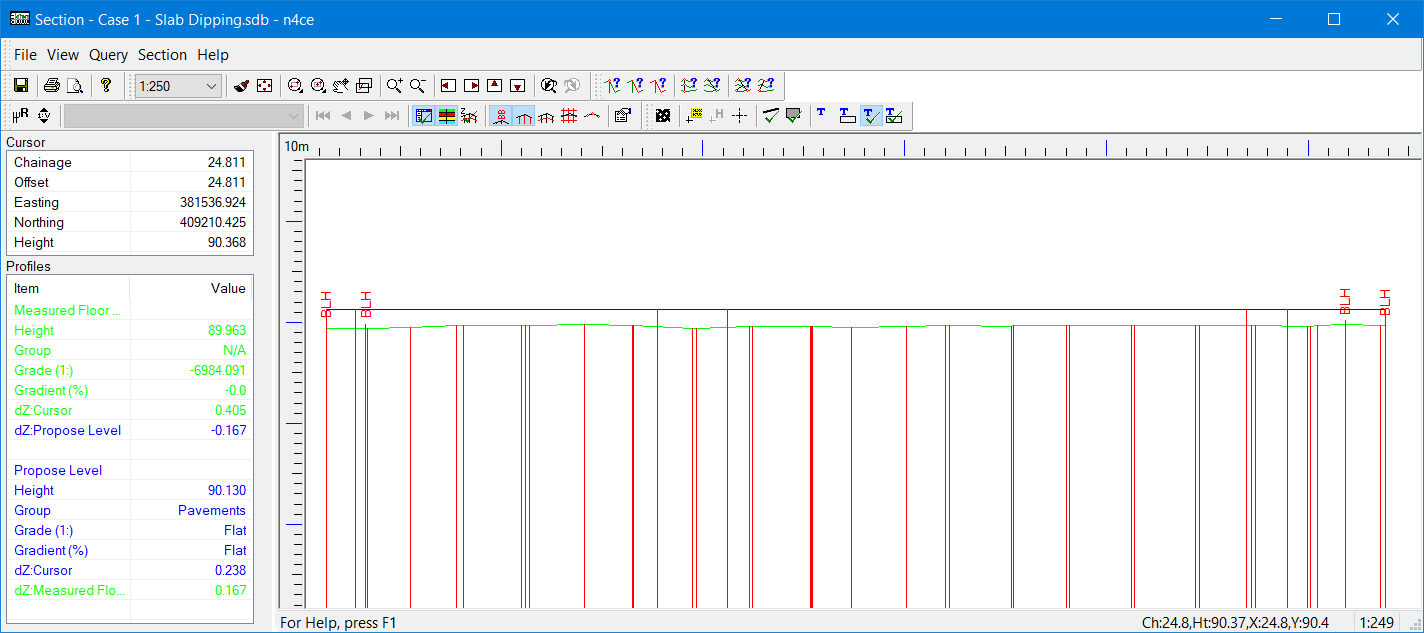
Section Through the Floor Slab and Sub Base
Note: As you move your cursor over the profile area you will see the data panel on the left change, including height difference. Even though we have used a 5x vertical exaggeration it’s still difficult to clearly identify the highs and lows. We need to identify the “bigger” picture!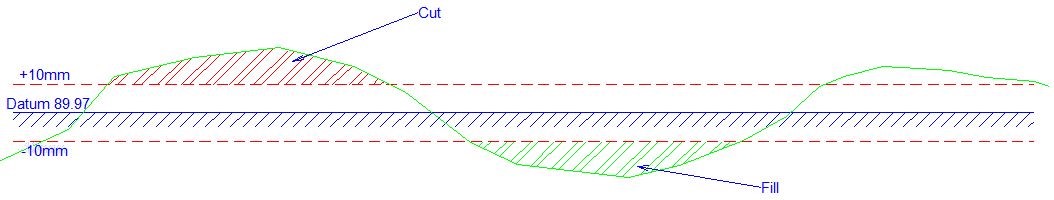
Tolerance Checking
We need to identify the Cut and Fill quantities outside of the tolerances, as shown above.
- Firstly remove the Datum (89.97) from the Measured Floor Slab sub-base, in the project grid (Spreadsheet). This will give the offsets on either side of the datum and if required can be used to calculate the overall cut and fill quantities to a datum of 0.0. But of course not taking into account the available 10mm tolerances.
2. In Settings DTM Settings elect User Intervals with intervals -0.1 (Green), 0.0 (Blue) and 0.1 (Blue).
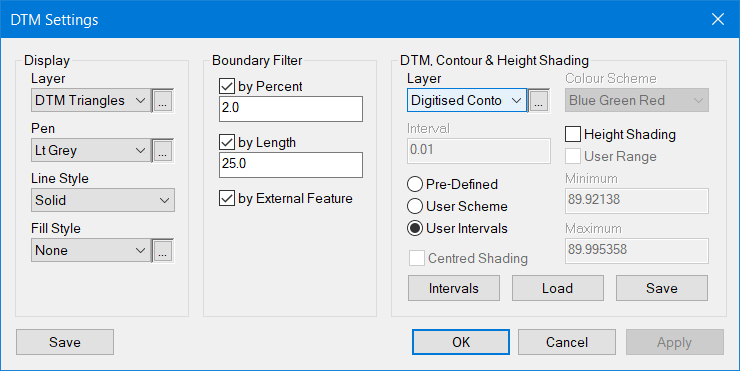
DTM Settings
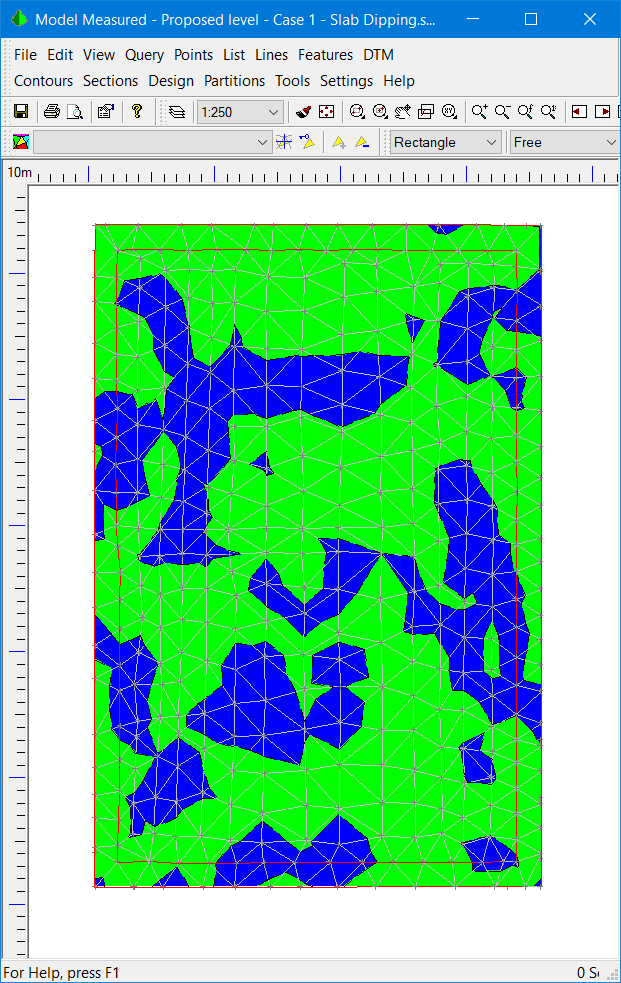
Use the shortcut (ALT+F9) to turn on shading. In this case, the green area is void (fill) and the blue area material (cut). Using Prism volumes with a Datum height of zero gives a Cut of 2.94m3 and a Fill of 10.52m3. The balance is 7.59m3 of additional fill. But this is not what the contractor wants to know.
3. Returning back to the Settings DTM Setting dialogue, and select the User Intervals for Shading.
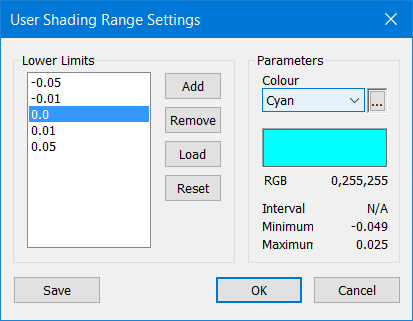
Setting User Intervals for Shading
Colours run from the top to the bottom, so the colour for 0.05 is a dummy code. Set -0.05 to Green, -0.01 to Yellow, 0.0 to Cyan 0.01 to Blue and 0.05 to Blue.
-
- Using the above Interval settings the following shaded image will appear, clearly identifying the cut and fill outside the +/-10mm tolerances.
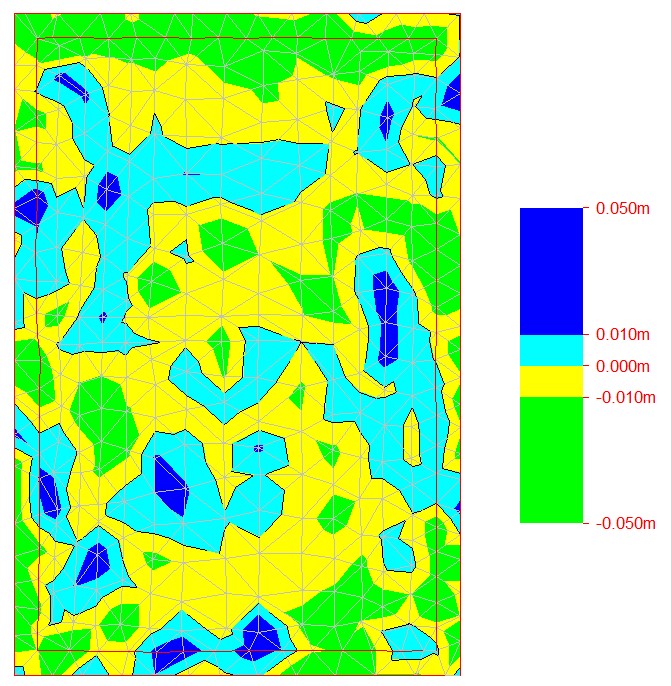
Final Shading Using Tolerances
- Using the above Interval settings the following shaded image will appear, clearly identifying the cut and fill outside the +/-10mm tolerances.
The Cyan and Yellow shaded areas indicate cut and fill within tolerances and the Blue and Green areas are where tolerances are exceeded.
5. To calculate the excessive (blue) material use the prismoidal volume calculation with a datum of 0.01 giving a value of 0.015m3. T
6. The void (green) can be calculated by using a datum of -0.01 giving a value of 2.58m3.
7. If you have the Pro/Des edition there is a special option called Datum Vols. This breaks up the quantities into bands giving you cumulative values.
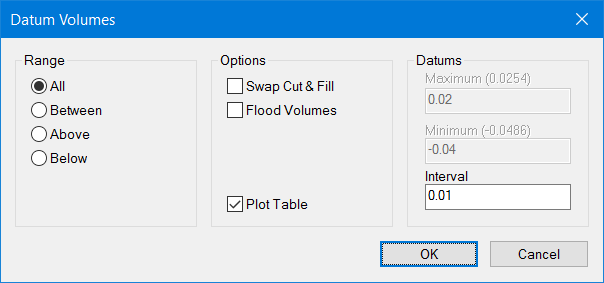
Datum Volumes
Datum Volume dVolume Volume dVolume Area Area
Level Above Above Below Below Above Below
------------------------------------------------------------------------------------
0.02 0.002 44.808 0.963 1860.022
0.152 -18.457
0.01 0.154 26.351 62.541 1798.418
2.783 -15.826
0.00 2.937 10.524 615.032 1245.893
10.663 -7.947
-0.01 13.600 2.577 1463.054 397.901
16.579 -2.030
-0.02 30.179 0.547 1774.270 86.703
18.156 -0.454
-0.03 48.335 0.094 1841.767 19.217
18.520 -0.089
-0.04 66.855 0.005 1859.122 1.863
--------------------------------------------------------------------------------------
Summary of Case Study 1
This case study identifies how n4ce can be used to analyse floor slabs to isolate and highs and lows of construction from a datum value. Tolerance checking can be applied to highlight areas that fall outside acceptable levels using shading. Quantities can be calculated to identify cut and fill volumes if required.
Also, look at isopachytes. These give you a height difference model between two models but would be difficult to apply tolerances as identified above
Comments
0 comments
Please sign in to leave a comment.