The Design Menu in the DTM graphic view has options which allow you to manipulate n4ce string data in ways appropriate to railways. These are the Railway options and can either be found as a series of options on the Design Menu or as an option called Railways that creates a pop-up menu, as shown to the right.

Overlaps
When surveying railway tracks, it is normal practice that an overlap of points is created. As you survey along a rail, you may suspend the survey of the rail whilst surveying other objects, such as the other rail or a platform edge. When you resume surveying the original rail, you should re-survey a number of the previous endpoints, three is usually sufficient. The Overlaps option allows you to correct these overlaps with new values and generate a report on their accuracy and should be used before other railway options.
Before you can perform the overlap operation, you need to ensure that your rail features are continuous. If you have surveyed along the rail in the same direction with a unique code for the rail, this can be carried out by ordering the survey by code in the grid view of the model. To do this, right-click over any item in the Code column of the grid and select the Order option. Otherwise, you will have to manually move the points into the correct position. Note that the expected overlap sequence is of the form 1,2,3,4,5,6,4,5,6,7,8,9 rather than 1,2,3,4,4,5,5,6,6,7,8,9 as n4ce relies on a near 180° change in direction of the string to identify the overlap.

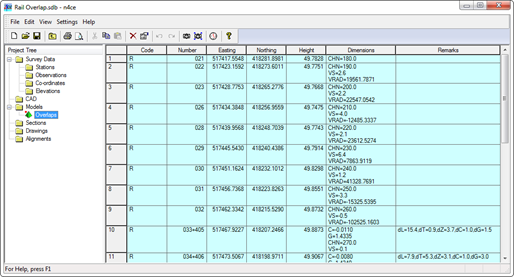
The example above shows a rail string with an overlap. Points 033 to 036 will be overlapped with points 405 to 408. View the model graphically and select the Overlaps option from the Design or Railways pop-up menu. The Rail Overlaps dialog, shown below will then be displayed. This allows you to enter the tolerances for the overlap report together with additional options.

The Dimensions group allows you to define the dimensions that n4ce will be looking for. There are three fields.
Chainage The Chainage field shows the dimension where the chainages along the rail feature are stored.
Cant The Cant field shows the dimension where any cant information is stored.
Gauge The Gauge field shows the dimension where any gauge information is stored.
The Tolerances group allows you to set the tolerances for overlap reporting. If any of these tolerances is exceeded in the overlap calculations, it is highlighted in the report. When performing the overlap operation, the two points are averaged and the tolerances are flagged up when the averaged point is compared with the two original points. Five tolerances can be set.
Longitudinal This field displays the tolerance for distances along the length of the rail.
Transverse This field displays the tolerance for distances perpendicular to the direction of the rail.
Height This field displays the tolerance for height differences
Cant This field displays the tolerance for differences in recorded cant information.
Gauge This field displays the tolerance for differences in recorded gauge information.
The Save Deleted check button allows you to specify that a copy of the original overlap points is saved away in a co-ordinate block. If this is checked, you will be asked to enter the name of a co-ordinate block in which to save them.
The Report C&G check button will allow you to include a cant and gauge check in the report that is generated. You have to have cant and gauge dimensions on both points in order for this to be included. An example report is shown below. Note that the tolerances that you have entered in the dialog box are displayed as part of the report.

When completed, the original overlap points will be removed and replaced by average values. These have point numbers which are a combination of the numbers from the original two points. Also, each of the new points has information stored in the Remarks column showing the various delta values calculated and displayed in the report.

Templates
The Templates option allows you to calculate the co-ordinates of both rail strings from measurements to two prisms attached to an adjustable track measuring device, TMD. This option is very specific and at the moment, we know of only one such TMD to which this option applies and that is not in this country! For the more common TMDs, you should use the Cant Stick option below.
Cant Stick Surveys
The Cant Stick option allows you to take a rail survey carried out using a cant stick or TMD and create the feature strings representing the two rails. The example below shows a rail string created from a cant and gauge survey.

Each point on the string has two dimensions containing the measured cant and gauge at that location on the rail. View the model graphically and select the Cant Stick option from the Design or Railways pop-up menu. The Cant and Gauge Rail Survey dialog, shown below will then be displayed. This allows you to enter the details of the strings that will be created together with a template representing the geometry of the TMD.

The Strings group allows you to specify the codes of the two strings, with the first string being that to the left of the template. The two radio buttons control the actual position of the calculated strings.
P-Point the calculated strings will represent the inner or running edge of the rails.
Centre Line the calculated strings will represent the centre lines of the rails.
The Data group allows you to specify the dimensions used to store the cant and gauge on each point. The two radio buttons allow you to further refine the cant dimension.
P-Point Cant the cant dimension represents the height difference between the two inner edges of the rails.
CL Cant the cant dimension represents the height differences between the centre lines of the rails.
The Prism Offsets group allows you to specify the offsets of the prism along the TMD. The Height field defines the height of the prism above the plane through the top of the rails. The Distance field defines the distance of the prism from the inner edge of the first rail. Positive is to the right and so a TMD where the prism is in the centre will have a positive of about 700mm.
The Rail Details group define the geometry of the rail. The Width field defines the width of the top of the rail. The P-Point Depth defines the depth of the rail p-point below the plane of the rails.
After you have set the values in the dialog box, you will be asked to indicate the surveyed string and then the side to which to create the additional rail. The two new rail strings will then be created.
Creating Parallel Rails
The Parallel option allows you to generate a second rail feature where only one has been surveyed but the information about the cant and gauge at each point has been recorded. The difference between this option and the previous Cant Stick option is that this one assumes that you have surveyed the centre line of one of the rails. When you select this option, you will be asked to indicate the reference rail feature and then the side on which the second rail is to be created. The dialog box shown below will then be displayed asking you to define the parameters used to create the second rail.

The Parameters group contains the basic information for creating the parallel rail. The Code field is the code that will be assigned to the second rail. The Cant Dimension and the Gauge Dimension fields show the dimensions that will be looked for the appropriate data which must be present in the seeding string. The Chainage Dimension is the chainage along the rail. This does not have any direct effect on the calculations but will help clarify the position of the new points with respect to the overall track survey. The two radio buttons allow you to further refine the cant dimension.
P-Point Cant the cant dimension represents the height difference between the two inner edges of the rails.
CL Cant the cant dimension represents the height differences between the centre lines of the rails.
The Tolerances group contains the information needed for tolerance checking and reporting and the required units of each field are defined in its title. The Gauge field shows the gauge to which it is assumed that you are working with. The Gauge field shows the tolerance which will generate a failure notice in the report. The Maximum Cant field defines the maximum allowable cant.
When moving along the rail feature, you would expect there to be a smooth transition from one point to the next. The Change in Cant field allows you to specify a maximum allowable change that can occur between two points. The Change in Grade field allows you to specify the maximum allowable change in the gradient of two successive rail feature segments and should be specified as a percentage. In the example above, the maximum allowable change in gradient is 0.05%.
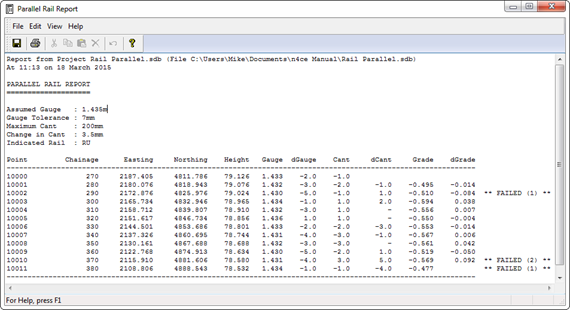
The calculations will then be performed, and the report will be generated is a report window. If, after the calculations have been performed, there are warnings that tolerances have been exceeded, you will be asked if it is OK to continue. Whatever happens, you should review the report to ensure that there are no gross errors in the data. If there are no tolerance errors or you are happy to continue, the parallel rail string will be generated in the model. An example of a report is shown below.

Rail Versines
The Versines option allows you to add information about the vertical profile of a rail in the format of versines and vertical radii. The versine is the perpendicular offset of a point from the line joining the points on either side. Therefore, versines cannot be calculated on the first and last points of a rail string. After selecting the option, you will be asked to indicate the rail string to process. Where possible, dimensions are added with VS representing the versine in millimetres and VRAD representing the vertical radius in metres at the point. The vertical radius is calculated assuming an arc through the point and those either side.

Planar Offsets
The Planar Offsets option allows you to generate information about the offsets of the points of a string from the plane created by two other strings. This is useful when checking platform clearances. You will be asked to indicate the platform line feature and then the two rail line features. The first rail line feature that you indicate should be that which is closest to the platform. The planar offsets of the platform string are then calculated for each point and added to the dimensions using PLD for the distance offset and PLZ for the planar height offset.
For this to be carried out, the points need to be surveyed so that each point in a section across the tracks has the same point number.
Cant and Gauge Reporting
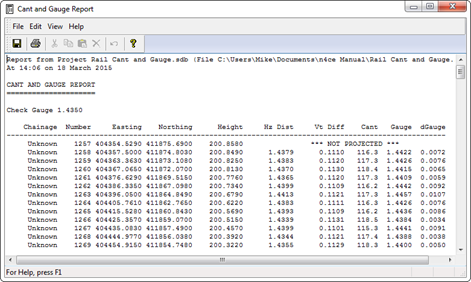
The Cant & Gauge Report option allows you to compare two surveyed rails to check the cant and gauge between them. You will be asked to indicate the two rail features and then define what the assumed track gauge is using the simple dialog, shown to the right. The Gauge field also contains a drop list which can be used to select some of more common, and not so common, track gauges. The first rail will be projected onto the second rail to create a report, an example of which is shown below.

Note that the first and last points are sometimes not projected due to the geometry of the projection. If you indicate the rail features the other way around, the projection may work.


Comments
0 comments
Please sign in to leave a comment.