
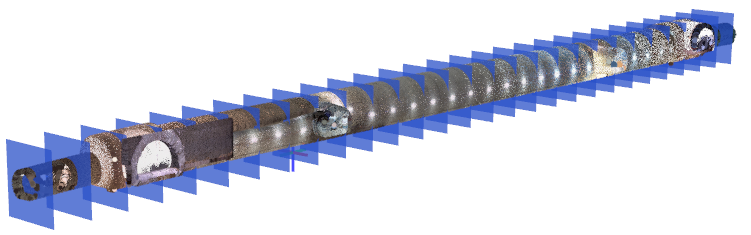
This article explains how extract point data at regular intervals from a Point Cloud. The output will be the baselines that were used, the point data at those locations, and an associated image to go with each section.
Before we can use this tool, we first need a 3d line feature to run the sections down. This feature can be a pre existing one that was surveyed manually, or possibly a converted 3d polyline from a CAD drawing. Either war for this example however we will assume there is no prior string, so we will need to generate our own.
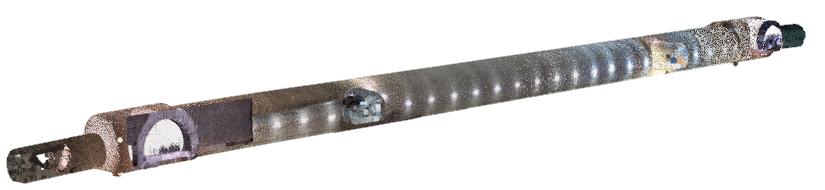
Our source data is a scan of a newly lined underground tunnel. So we will start by using the new Multi Plane section tool, and then indicate the tops of either end of the section. Having selected the start and end, RIGHT CLICK to cancel the tool.
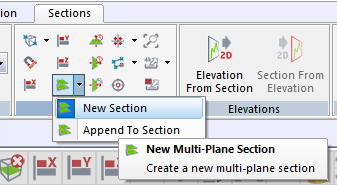
This defines a rough centerline down which we can slide a cross section.
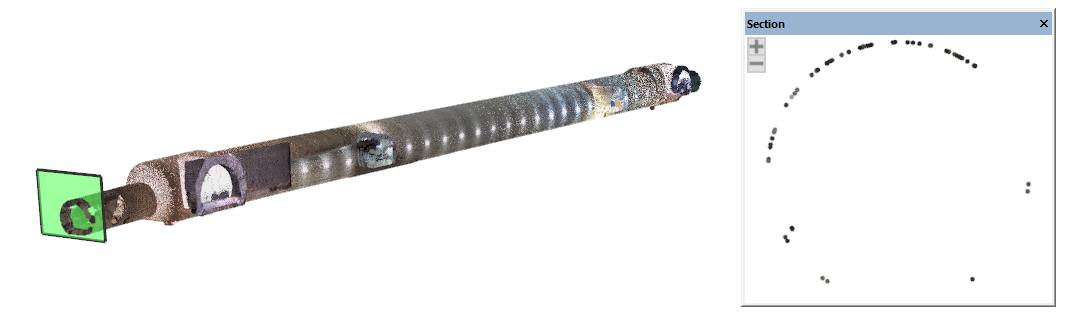
Now that we have this initial section, we can use the Cylinder finder to locate the approximate center of this tunnel.
Under the Digitise tab, enter a suitable code (that draws a line) for the Centerline, and click Find Circle. If you need to, adjust the section thickness, and position so that a good section can be taken, then hit Find Circle Again.
When a suitable circle has been detected, click Digitise Circle.
Now slide the section into a new position and repeat. Do this only where the tunnel changes direction. You will end up with a 3d Feature that runs approximately down the center of the tunnel. This is what we will use to start the Multi Section Extraction.
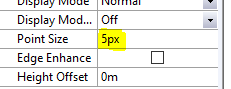
Before continuing, is is probably a good idea to set the point pixel size for the point cloud data to 4 or 5px. Otherwise, if section images are taken, the points may be to fine to pick out in the image.
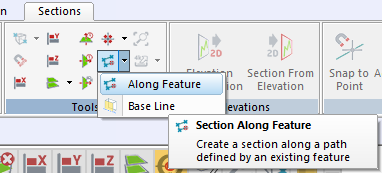
To switch to using the 3d Feature as the alignment for the sections, click the Along Feature tool, and click the new 3d Feature that has just been digitised.
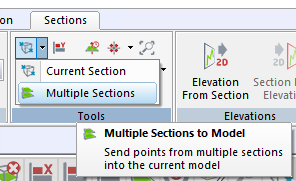
Then with the new section in place, click the Multiple Section tool and a new set of options will appear on the right.
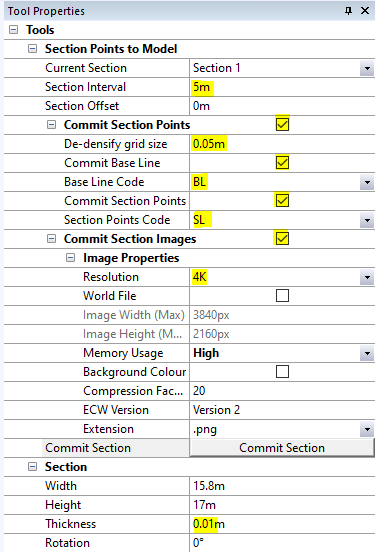
Critical settings are highlighted in yellow. These are as follows...
- The section Interval to use.
- Whether or not to extract the points on the sections. If so, what de-densification grid size should be used. Obviously sending all the point data on each section would be information overload. So the de-densification value controls the degree to which the data is thinned. A good starting point is 5cm or 0.05m. In which case one point per 5cm squared is permitted though the filter.
If points are to be extracted then you can elect whether to also extract the baseline locations, and if so what code to use for them. Like wise for the actual extracted points too. - Should an Image for each section be saved as well. If so, what resolution and format. 4k PNGs which are the default should be more than good enough for most situations.
- How thick should the sections be? With normal dense scans a value of 0.01m is usually plenty. But this can obviously differ from location to location. This value should again be kept to a practical minimum to avoid extracting an unnecessary amount of data.
The option to output the world files should only be enabled if a image needs to be opened in another CAD system. Otherwise leave the option clear as they will interfere with n4ce tiling them later on in a CAD drawing.
Having configured the tool press Commit Section. This will start the extraction process. If images are enabled, then a dialog will prompt for the location to save the images. n4ce will then create a folder off of this location to store the images in.
When its finished the extraction process you can visualise the points that were extracted by turning the Display mode of the point cloud to Off, and cancelling the Section.
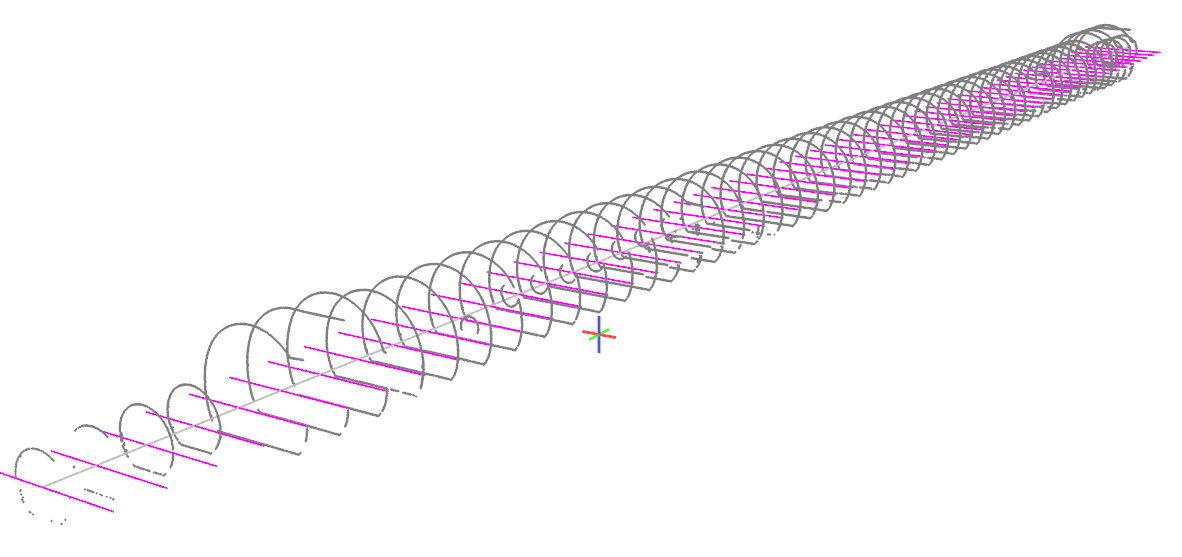
The Model will render the data based on the Codes you have used. It's recommended that the code used for the extracted points plots a small (0.5mm) Plus, with NO HEIGHT Annotation... Otherwise the screen can be swamped with point data.
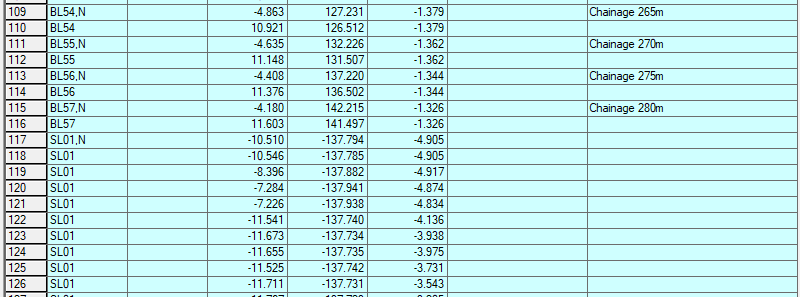
The data itself is numbered so that each point or baseline is numbered so that can be referenced to its location at anytime. Plus the data is organised perfectly for the Automatic Tunnel Section plotting command that will take each section and plot it in a CAD drawing.
For detailed instructions on how to plot these sections, please follow this link.
Comments
0 comments
Please sign in to leave a comment.