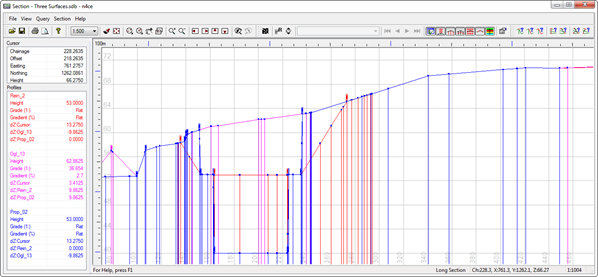
When sections have been defined and calculated, they are displayed in a preview window as shown below.

The example in this window shows a section taken through three surfaces displayed in red, magenta and blue. The normal zoom and pan functions that are available for all graphic views are available from either the View Menu or the toolbar buttons across the top of the window. If you are viewing a section that has just been calculated, you will be asked to enter a name for the section when leaving the window. This name will be used to identify the section in the project data tree. If you do not wish to save the section, press the Cancel button.
The pane to the left shows live information that is calculated as you move the mouse. The Cursor block shows the chainage and offset along the section of the current position of the cursor together with the co-ordinates of the cursor in plan. The height is taken from the cursor position in the profile window.
The Profiles block shows further information about each profile as follows. For each profile, the name of the DTM from which the profile is calculated is displayed first. After this, appear four values as follows:
Height - The height of the profile when the cursor position is dropped vertically on to it.
Group - The group of the profile at the cursor position.
Grade (1:) - The grade of the section profile at the cursor position expressed as 1 in.
Gradient (%) - The gradient of the section profile at the cursor position expressed as a percentage.
dZ:Cursor - The difference in height between that profile and the cursor height
If there is more than one profile, there will be further values showing the differences in height between the various profiles. A positive difference shows that the profile is above the profile to which it is being compared.
You do have the option to display the values in the data pane in the same colour as that which is used to display the profile in the preview. This is described in the next section.
Towards the right of the toolbar in the preview window are a series of buttons that control the display of the profiles. Seven buttons are simple toggles that turn information on or off. If the button is pressed in, the item will be displayed.
 Data Pane - Toggles the display of the data pane to the left of the section view
 Codes - Toggles the display of codes on the section profile
 Drop Lines - Toggles the display of drop lines for each profile
 Group Depths - Toggles the display of a profile representing any group depths for each profile
 Grid Lines - Toggles the display of the grid lines and associated text
 Points - Toggles the display of points on each profile
 Colours - Toggles the display of information in the data pane to be the same colours as the profile line
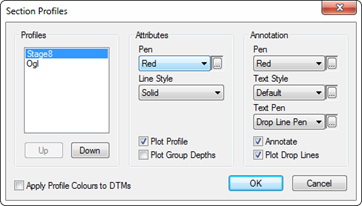
 To the right of the above buttons is a button that allows you to control the display parameters used for each of the profiles. When selected, a dialog box like that shown to the right will be displayed.
The Profiles group shows the profile names in the current section. Initially, these are set to be the name of the DTM from which they have been calculated. To change the name of any profile, double-click over it with the mouse and a simple dialog box will be displayed allowing you to enter a new name.

The Up and Down buttons allow you to change the order in which profile annotation is displayed when creating a final section plot. This also affects the order in which section information is displayed in the section preview data pane. When you select a profile, the remaining parameters in the dialog box change to those currently assigned to that profile.
The Attributes group allows you to change the pan and line style used for the profile line. The Plot Profile check button allows you to turn of the display of the profile line and its associated annotation. This will happen in both the preview and the final section plot. If the profile line is displayed, the Plot Group Depths check box is also available. This allows you to show the effect of any group depths in the model. Any parts of the profile calculated from triangles in groups with depths will have an additional dotted line displayed below profile showing the group depth position.
The Annotation group allows you to control the display of the drop lines and any text annotation for the profile. If they are displayed, drop lines will always be generated using a solid line but the Pen field allows you to change the colour that you wish to use. The Text Style and Text Pen fields allow you to change the display of any annotation text. The Annotate check button allows you to set the display of codes for the current profile in the section preview and overrides the settings of the code display toggle. Similarly, the Plot Drop Lines check button allows you to set the display of drop lines in the section preview regardless of the drop line display toggle. There are two special pens that have been added to the selections in the Pen and Text Pen fields.
Profile Pen - This allows you to specify that either the drop line or its associated annotation text will be displayed in the same pen as the profile itself.
Drop Line Pen - This allows you to specify that the annotation text will be displayed in the same pen as the drop line. If the drop line pen is set to be that of the profile, then the profile pen will be used.
To the bottom left of the dialog is a check box called Apply Profile Colours to DTMs that allows you to take the colour defined for the profile and assigned that as the colour assigned to a model for backcloths. This can only happen if the name of the profile has not been changed and is the same as that of the model.

Comments
0 comments
Please sign in to leave a comment.