The following article describes how new functionality in n4ce 4.30 allows drainage run sections to be quickly and easily generated from survey data with little or no additional tidying up being required afterwards in CAD.
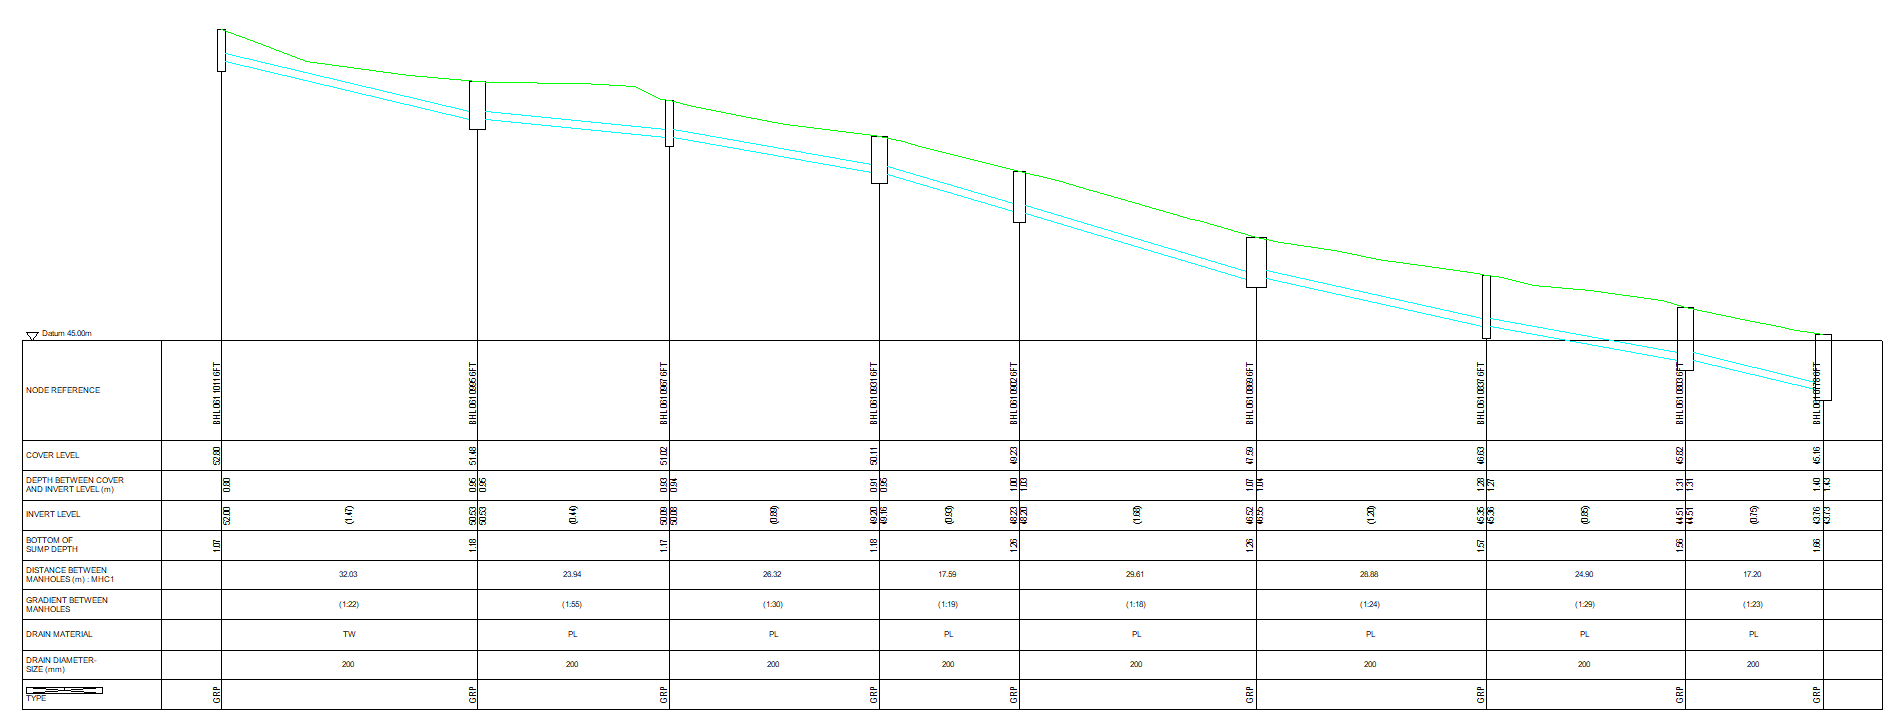
An example of what is achievable is displayed below. No additional CAD data has been added. This is all generated with the addition of new features added to n4ce 4.30.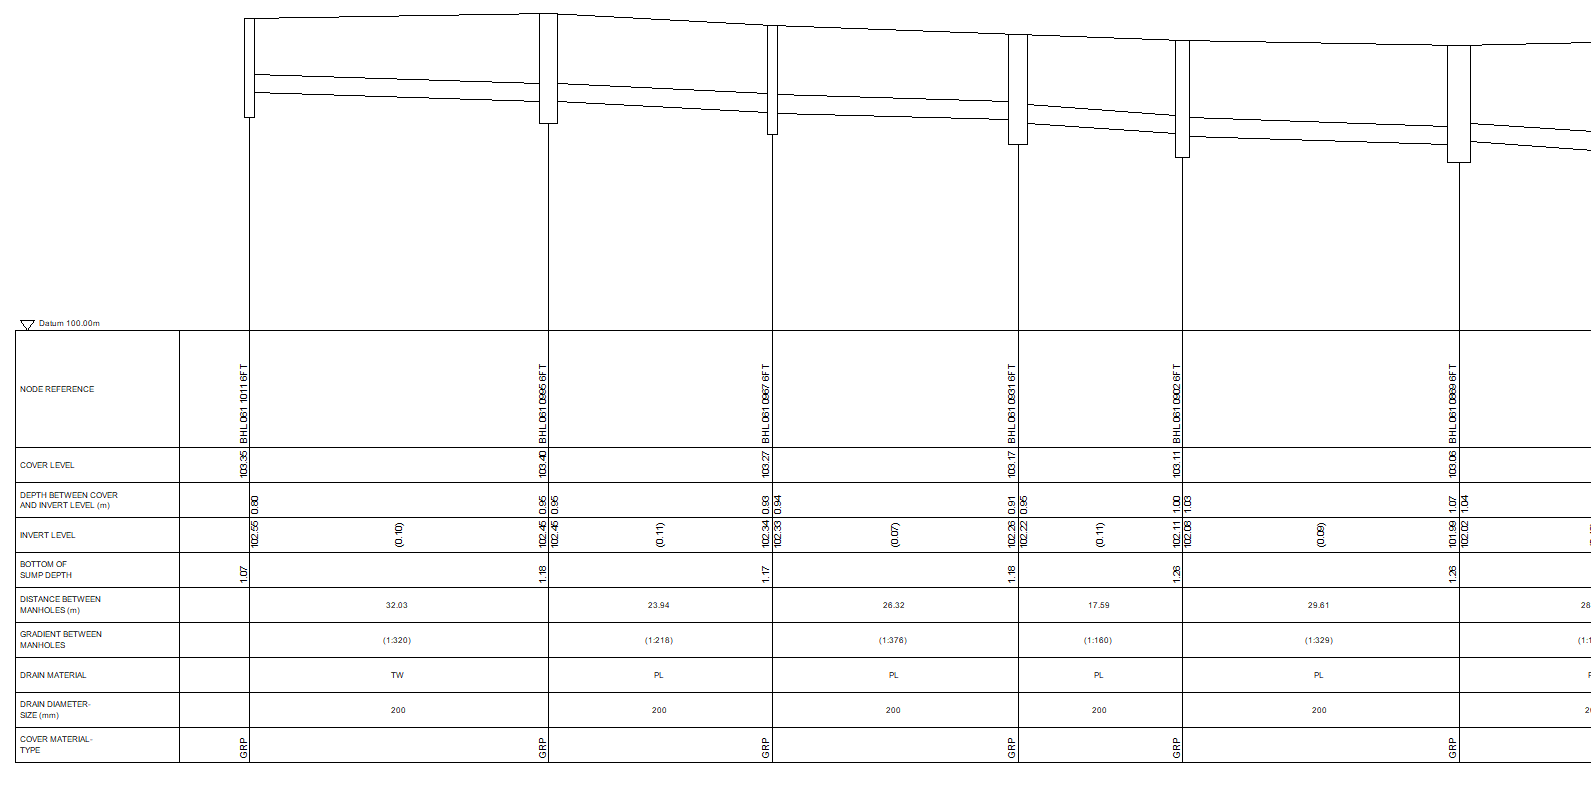
Step 1.
For the section to work, we first need a series of survey points that represent the drain run. This data is ideally imported and processed from the raw survey data, so that the attributes can be preserved.
Here is an example of a 1pt Circular manhole point may look,

A series of them, with the Line enabled as part of the Code, could look like this..

In terms of the CAD elements, the rectangle that represents the chamber is setup as a Section Symbol on the MHC1 code.

Note that the symbol has is Origin Middle Top of the square. This is so that the symbol will scale down from that point, for its Depth, and will also scale its width symmetrically about its center line. To help with this example, the symbol is also attached to this article.
Below you can see the section symbol in use. If you refer back to the screen shot above, of the raw data the SH= attribute defines the symbols height (i.e. the total depth of the chamber), and the S= its width.
Step 2.
Having got the survey data and turned it all onto a Model. We can now start the process to actually take the section. Assuming the points are strung as above, then you can use the Menu option Sections - Feature. If however the points are not strung, then it would be Sections - Points. Assuming the points are strung, we will use the Feature option.

Set the options exactly as they are above. If there is a second Model with a DTM of the surface in, then move it over to the Selected side under the Models tab. If you want to see any crossing Features in the ground model. Then tick the Features tab, other wise just tick the Dtm Facets option. Press Ok and click on the line representing the drain run. A preview window will then appear showing something similar to that below.

Note the line work for the pipes has also been drawn, and not just the chambers. The pipework is added automatically once the "Drain Run" option is ticked. That tells n4ce to look for the DI1,DI2 & DD attributes to control the depths and sizes to plot.
Click on the Properties icon, or goto Section - Properties in the preview and change the colour of the line used for the second surface, plus untick the "Annotate" and "Plot Drop Lines" options.
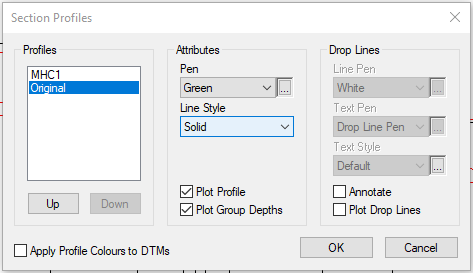
For the drain run itself just change the line style to "None" so that there is no line drawn at the ground level between the manholes. The preview should now look similar to this.

To continue, close the preview window and assign a suitable name to the section when prompted. Now that the section has been taken, and saved into the Project. It needs to be plotted in a CAD model so that we can create the final deliverable.
Step 3.
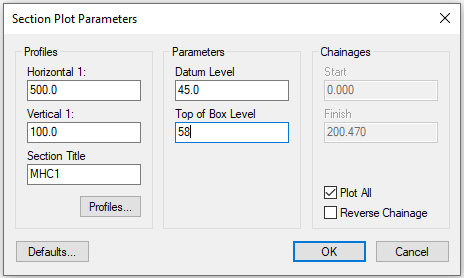
Create a new blank CAD model in n4ce and view it. From the Sections menu select Plot - Single. Select the feature section that was just taken and press Ok. Set the scales, plus the Datum and Top Of Box levels to appropriate. values. Setting the Top of Box level to atleast 5m higher than the value suggested usually leaves enough room for the additional annotation at the top of the section, and set the Datum level lower than the lowest invert, so that there is room for the chambers.
Press Defaults.
This is how and where the additional items of annotation are added to the section plot. Click the Define button to setup the required annotation.
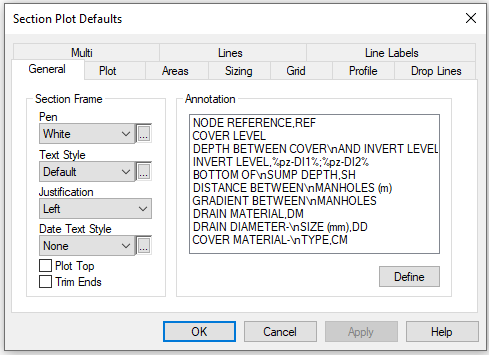
Plotting or arbitrary data such as the REF attribute is accomplished by pressing Create and then configuring it. Below an item of annotation called "NODE REFERENCE" is being created. After the description a comma is used to identify which attribute to plot after the description. So the full title is NODE REFERENCE,REF, to pluck out the REF attribute.
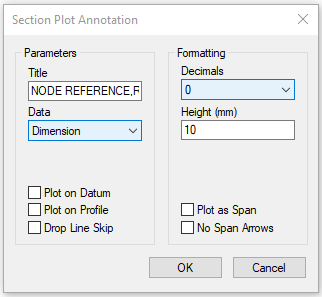
Set the data type to Dimension, and then configure the other options as required. If an item should be plotted on the profile, rather than in the boxes below, tick "Plot on Profile".
To put a new line into the Title, use a \n. For example... COVER MATERIAL-\nTYPE,CM

The two inverts, one each side of the chamber are plotted thus.. INVERT LEVEL,%pz-DI1%;%pz-DI2%. Their format is very similar to text macros. Anything inside a %% is something to extract or plot, and a second value after the ; describes what to plot the other side of the drop line. Here both items are taking an attribute away from the height of the point (pz). Hence the output looks like that below.

Note it will automatically plot the drop along the length in brackets between the manholes. Because the section was previously identified as as Drain Run.
Distances between manholes, and the gradient are plotted, by specifically selecting those data types when setting up the Annotation to plot.
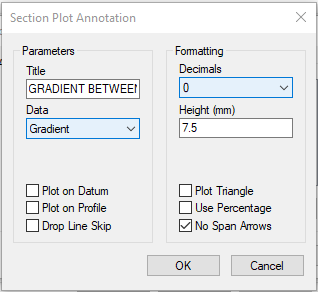
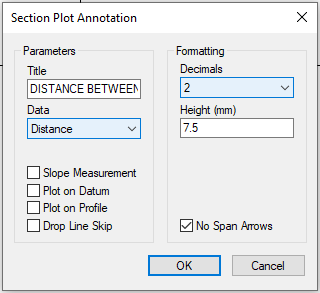
With all the items setup, press Ok, till you are back at the Section Plot Parameters dialog. Press Ok once more to finish plotting, give the Section a Layer name when prompted and place the section where it needs to be plotted.

Comments
0 comments
Please sign in to leave a comment.