
The following are samples of how you may use the coding systems identified in the article, Code Table and Feature Plotting.
Example 1 - Using Line Features for Road Marking
There are multiple ways and options to create road markings, the example below is simply using one of the line styles that ships with n4ce. You will find it under the Lines Tab in the drop-down menu labelled Style. There are many similar line styles to the one below with different length options.
Another handy option to pick up the start and ends of dashed lines, would be to use the Alternate Segments option in the Lines tab. This option replaces the simplicity of using a dedicated Line Style as shown above. To use Alternate Segments, you must replace the Line Style with a solid line style. This allows you to choose the start and end of each road marking.
Note: The sizes given are real sizes in mm. For example, the line style 1000x1000x250 gives a solid repeat line 1m long, 0.25m wide with a gap 1m.
Example 2 - Using Requested Symbols
In the example shown above, a gulley is placed at points 2 and 4. The Symbol shown at these points was created by using 1-Pt Requested in the Symbols menu and added the comma code ,S to the individual points. The gulley takes the alignment from the feature and is directional. If the line is reversed the gulley would appear on the bottom of the line. In addition, we also used the attribute M to add a gate between points 3 and 4.
Example 3 - Changing Codes Using N= or / (Import Only)
When you are picking up detail and wish to change a feature code without a duplicate point, the dimension N= can be used, as indicated below.
At Point# 3 a dimension N=GT is used to change the code to a gate.
At Point# 4 an N=HE is used to start a hedge.
In the dimension dialog you will find Code Separators / and ; . The N Dimension can be replaced by the / character and the M Dimension by the ; character, but ONLY when the Code Import Convention is set to either AiC (Dim Labels) or AiC (No Dim Labels), and ONLY when Importing files. This forms part of the code import. e.g. FE/GT.
Coding for Point# 3: FE/GT and Point# 4: GT/HE and no Dimensions are required. n4ce will convert these into N= when importing codes.
|
Code Table Conventions |
New & Seg Codes |
Example 4 - Changing Codes Using M= or ; (Import Only)
The M= dimension is ideal for changing the next segment and then continue with the same code. The example shown below is for a gate but it could easily be adapted for drop kerbs. M=GT on point# 3. The code for the string is still HE, so ordering will not affect the string.
Code Separators ; will work when importing data. For example, at Point# 4: HE;GT.
Example 5 - Line Widening/Tapering
The example directly below can be created by giving points along a line feature variable Width (W=) values
The Width Scalable option can be found in the code table, under the Lines menu of the code prefix (see below image)
The dimension W= is used to control the width of line features, like hedges and dual lines. In the case of hedges, you need to set the Line attributes to Width Scalable. Negative widths offset to the LEFT and positive to the RIGHT in the direction of the line. Refer to the image on the right for an example.
Also, note there is an option to offset the width by half of the features width, so you can survey a hedge from one side instead of its centre. Enable this option by clicking on Offset Half Width in the settings under the Lines tab.
The example below shows how the 'O' dimension displays lines
(Negative values show the hedge to the left and a positive value shows the hedge to the right of the points)
Only a limited number of lines are width scalable. Disabling the Width Scalable option, and subsequently enabling the Variable POW (Parallel, Offset and Width) option allows the W= dimension to create twin lines (as seen below). The Variable POW option is also found in the Lines Menu in the settings box. Users can individually change points Width dimensions so that the line changes widths from one point to the next.
Below is an example of the Variable POW option enabled and each point has a different width value
A further attribute can taper variable widths, as shown below. Additional options are available using the parallel offset dimension P= and setting different line styles using FPL= and FCL= for defining a centre line. See examples below:
An example of the FCL, FPL and Parallel dimension values working together
Example 6 - Line Formations
Another useful dimension is LF= which is used in situations where survey detail can only be collected using taped measurements, as access or line of sight is restricted or obstructed. The direction and length of the offset from a fixed baseline is governed by pairs of numbers. The first number defines the direction as identified above. Pairs of numbers are separated by spaces, commas, a slash, or a hash character. For example LF=0,4.5,-2,1.5,2,2.5,2,1.5. The underscored character identifies the direction and the following value dictates the length.
Example 7 - Text Labels
Along with Height, Code and Number annotation, general Text can be added to a point by activating the Text tab in the code table, and/or using the T= dimension. If the text item is in the display window as shown to the right, it will be displayed according to the alignment option. The T= dimension, if present, will overwrite the contents of the Text window. A special option called 3 Point Text (3-Pt Text), allows you to pick up road labels as shown above.
The example to the below demonstrates the T= dimension in use, here we have used the original three points but the T= dimension is allowing us to override the 'STOP' text with 'No Entry'.
The 'No Entry' text is must be entered in the dimension fields column under Value, please watch the short video below for reference.
Example 8 - Road Markings
There are several options for plotting symbols, all identified within the Type drop-down menu found in the Symbols tab in the code table. We’ve already seen how to plot different line styles, but here we will identify arrows. The same applies to text labels, stored as symbols. Above, you can see an example of a 3-point arrow symbol which would be used to alert drivers of a split in the road. (This symbol is purely for demonstration purposes and is not included within n4ce)
Symbols need to be drawn in CAD, either in n4ce or imported from AutoCAD as a block. Blocks from AutoCAD representing symbols will need to be exploded and reformed to generate the additional handles. Please note the direction of the points as this will generate a mirrored symbol, if incorrectly sourced.
The following link takes you to the article that explains how to create your own symbols: How to Create Symbols
Example 9 - Centre Point Annotated Shapes
There are several ways of plotting Shapes which you can use to display manholes and other regular objects like lampposts. One of the options you might may find useful is 3-Pt Rectangle Centre, which allows you to locate and size a man hole with three points, using the first point for its level. The First Point option can be enabled in the height settings whilst selecting the type.
This could be used with Hide Second Points to remove all detail attached to the 2nd and 3rd points. Alternatively, enable On First Point in Heights, Numbers or Codes. In the example shown above, point numbers were plotted on each point and the height on the first point, with the 3Pt Rectangle Centre.
Example 10 - Hash codes (#)
The examples shown above of adding an additional code to a point using the Dimensions N= and M=, can be further expanded using Hash (#) coding. Like \ and / coding, this ONLY works on imports and involves using multiple codes assigned to a point, delimited with a # character. For example, the code BB1#TB5#FE will provide additional links to the source point BB1, to TB5 and FE. n4ce will generate additional observations or coordinates for the # codes. The import conventions previously discussed for Dimensions and Comma Codes still apply. e.g. E_W_1.2#GT. (Where _ is a space character). Here, a hedge with a width of 1.2m will be joined to a gate. Auto Stringing also works with this option.
A step by step example is provided below:
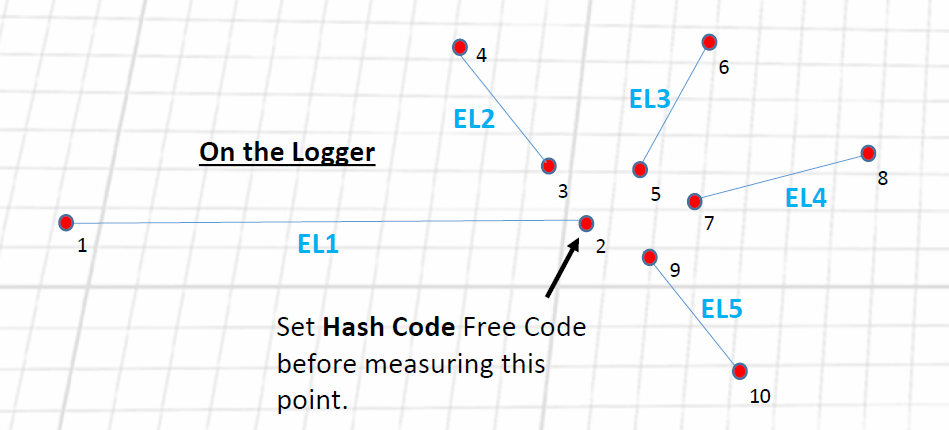
- Before measuring the junction point, display the Free Codes
- Select the Hash Code Free Code (#)
- Enter the Code and String numbers of the points that branch out from this junction separated by a # for instance: EL2 #EL3 #EL4 #EL5
- Record the point as normal
- Record the other strings with the appropriate string numbers and codes
- Once imported, n4ce will generate the additional points on import
This image demonstrates what users will see on their loggers before it has been imported into n4ce
This image represents the outcome of the data once it has been imported into n4ce and the # data has been displayed
Example 11 - Appending Observations into a Model and Merging Models
If a new survey represents a revision of an existing area that has previously been surveyed rather than an extension to the survey, the Merge Model feature (available in Pro and Designer) is generally the preferred method.
Begin by creating a separate Model containing the revised survey and generate a DTM. Once complete, in the project manager, right-click on the Models folder and select the Merge option. A new model will be created, ensure you have chosen a name for this model to distinguish it from the other models.
During the merge process, the software uses the DTM boundary of the new Model to replace the corresponding area in the original Model. N4ce replaces corresponding areas of the DTM with the New Model boundary so the existing survey points and DTM triangles are removed and replaced with those from the revised survey. The Merge Model workflow is therefore the recommended method whenever a new survey supersedes part of an existing survey.
The Copy and Paste coordinates method (Seen below) is best suited to extending a survey with additional data, for example there may be instances where you have created a Model and wish to update this with further survey detail. Circumstances can dictate a survey is carried out in stages, creating and editing a Model as each day progresses, or returning to site a year later to do an update. In the Project manager, right click the file in the Observations/Co-ordinates/Model folder and select Copy, then Paste the new data into your working Model (Observations must be reduced first before being copied). All the coordinates in each setup for this folder will be copied over. The original models DTM must be deleted and recreated to integrate the additional data.
Comments
0 comments
Please sign in to leave a comment.